Lord Flasheart
Legendary member
- Messages
- 9,826
- Likes
- 985
moved stop to 50
looking at nzd/jpy for a possible short from the 90 area
short eur/aud at 1.2426 sl 1.2445
It looks like they are manipulating euro a bit atm:whistling
Who`s "they" 🙂?
Various manipulators I guess - central banks, big players etc.
Ok. What are they doing to manipulate the Euro and why are they manipulating it?
Morning all
Long aud/jpy at 80.60 sl 80.37
To transfer money from the manipulated guys' accounts to the manipulators' accounts?
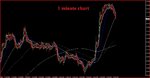
1 min eur/usd chart attached with some 'nice' moves
show off ( nice one ma lord )not bad for someone that does not like longs 😈😈settled for +19 and +60,nice
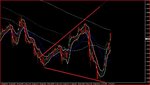
How many pairs do you draw the lines for and how often would you update them LF?
Also when drawing the lines, would you join only the extremes of the moves or something else? - I've noticed few lines on the last example are not at the extremes
archer flash has a secret arrow to draw his lines
:cheesy:
Ask all you like
The best answer I can give is experience,and its more about the pattern.Generally once a line has been broken and pulled back.then the place it has pulled back to is a strong indication of future resistance. Aslo I look at the price action.if there is a spike at an area then it tends to be there for a reason,i.e,it has spiked through the line. I guess years of losing gets you used to what looks right.Sorry I cant be more precise
ffs.look at that nzd/jpy.what a trade to miss.Ill have to thrash baldrick