You are using an out of date browser. It may not display this or other websites correctly.
You should upgrade or use an alternative browser.
You should upgrade or use an alternative browser.
buy eurjpy @ 113.34 stop @ 113.24
.
Attachments
Well it's good to buy it, but it already did 249 pips and ATR is 147. Anyway jpy is falling today, so I was thinking I'm not too late to join now...
Whatever the case I wouldn't be surprised if it hits today's high (around 113.56) just for the sake of taking stops if nothing else
buy eurjpy @ 113.37 stop @ 113.22
closed @ 113.57 for +20, risk -15
sell eurjpy @ 115.33 stop @ 115.48
>
Attachments
sell eurjpy @ 115.33 stop @ 115.48
No turning point as yet...
stopped for -15
Will Duxon
Active member
- Messages
- 175
- Likes
- 4
Hoping to Document Success
I'm planning to record my live trades beginning this week, so I'm using this post to start figuring out how to use the forum's available tools. I've developed my own trading system and proprietary indicators, which I have named "Proverbs 16:3" to give honor where honor is due.

The above screenshot is a Euro-Japan 15-minute chart and the strategy is extremely simple. If an asset is trending north, I enter a long position when price begins to rebound after falling below the floor of the medium violet envelope (click on the chart for a larger version) and I exit when it begins to pull back after breaking through the ceiling. If the asset is bearish, I do just the opposite, entering a short position when price begins to fall after climbing above the envelope's ceiling, and exit when it begins to bounce back after falling through the floor.
These envelopes are unlike any others I've seen and enable me to use historical data to analyze the typical price patterns that develop as a consequence of relationships observed between the trend, average price range and current market structure. As a result, I have no inclination to bother with lower panel indicators such as MACD, RSI, ADX, CCI or Stochastic Oscillators.
I'm planning to record my live trades beginning this week, so I'm using this post to start figuring out how to use the forum's available tools. I've developed my own trading system and proprietary indicators, which I have named "Proverbs 16:3" to give honor where honor is due.
The above screenshot is a Euro-Japan 15-minute chart and the strategy is extremely simple. If an asset is trending north, I enter a long position when price begins to rebound after falling below the floor of the medium violet envelope (click on the chart for a larger version) and I exit when it begins to pull back after breaking through the ceiling. If the asset is bearish, I do just the opposite, entering a short position when price begins to fall after climbing above the envelope's ceiling, and exit when it begins to bounce back after falling through the floor.
These envelopes are unlike any others I've seen and enable me to use historical data to analyze the typical price patterns that develop as a consequence of relationships observed between the trend, average price range and current market structure. As a result, I have no inclination to bother with lower panel indicators such as MACD, RSI, ADX, CCI or Stochastic Oscillators.
Last edited:
Will Duxon
Active member
- Messages
- 175
- Likes
- 4
Don't Try This at Home
Sell SPX500 @ 2181.17
Target @ 2175.09
Adjusted Target Hit @ 2180.42 / 11:14 GMT


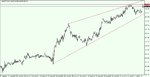
My strategy is designed to work in trending Forex markets. Since SPX500 did not qualify on either count, the above index futures trade was purely experimental. The take profit target was adjusted in accordance with my dynamic proprietary envelopes (see second image).
Price eventually broke through the floor of my secondary envelope (see third image) getting much closer to my original target level, so I believe with a few minor adjustments, this strategy will work with stocks as well as with currency pairs and metals.
Buy EURJPY @ 115.917
Target @ 116.144
My charts are suggesting that the impact of economic news released on August 26th is wearing off, in which case, I might have to eat a loss with this pair.

Buy USDJPY @ 103.855
Target @ 104.111
Again, if the impact of economic news released on August 26th is over, I might have to eat a loss with USDJPY as well.

Buy XAUUSD @ 1322.38
Target @ 1325.51
Target Hit @ 06:33 GMT


Buy GBPJPY @ 138.138
Target @ 138.437
Adjusted Target Hit @ 138.22 / 09:35 GMT


The above take profit target was adjusted in accordance with dynamic "trailing support/resistance" envelopes.
Sell EURGBP @ 0.8397
Target @ 0.8381
Target Hit @ 09:30 GMT


Though the target was hit at 0.8381, there was no reason to exit this trade above 0.8362, which would have meant about 20 pips of additional gains.
Sell SPX500 @ 2181.17
Target @ 2175.09
Adjusted Target Hit @ 2180.42 / 11:14 GMT
My strategy is designed to work in trending Forex markets. Since SPX500 did not qualify on either count, the above index futures trade was purely experimental. The take profit target was adjusted in accordance with my dynamic proprietary envelopes (see second image).
Price eventually broke through the floor of my secondary envelope (see third image) getting much closer to my original target level, so I believe with a few minor adjustments, this strategy will work with stocks as well as with currency pairs and metals.
Buy EURJPY @ 115.917
Target @ 116.144
My charts are suggesting that the impact of economic news released on August 26th is wearing off, in which case, I might have to eat a loss with this pair.
Buy USDJPY @ 103.855
Target @ 104.111
Again, if the impact of economic news released on August 26th is over, I might have to eat a loss with USDJPY as well.
Buy XAUUSD @ 1322.38
Target @ 1325.51
Target Hit @ 06:33 GMT
Buy GBPJPY @ 138.138
Target @ 138.437
Adjusted Target Hit @ 138.22 / 09:35 GMT
The above take profit target was adjusted in accordance with dynamic "trailing support/resistance" envelopes.
Sell EURGBP @ 0.8397
Target @ 0.8381
Target Hit @ 09:30 GMT
Though the target was hit at 0.8381, there was no reason to exit this trade above 0.8362, which would have meant about 20 pips of additional gains.
Last edited:
Will Duxon
Active member
- Messages
- 175
- Likes
- 4
Flaw Corrected
I'm currently in a bit of a fix with USDJPY and especially EURJPY, which both appear to be turning over on me, so in looking to improve my Proverbs 16:3 strategy, I plan to forego entering trades in the future if my primary envelope is not moving away from the direction where contact is made with the candlesticks.

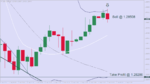
Here is an example of what I'm talking about, though I was unable to document this trade live. Price made contact with the floor of my primary envelope at about 08:00 GMT with the primary, secondary and tertiary envelopes all arguably headed north, which made it okay to enter the trade at 1.3303 (rather than the level suggested by the image). The envelope ceiling take profit target of 1.3332 was hit at 9:15, but given that no red candlestick formed, there was no cause to exit the trade until price began to reverse at 1.3366.


Yep, my lines (above charts) are telling me that the trip north for the yen pairs has almost certainly come to an end. The best I'm hoping for is to exit USDJPY at 103.57 and EURJPY at 115.60 to limit my losses to about 30 pips each.


I exited USDJPY @ 103.655 and EURJPY @ 115.507.
I'm currently in a bit of a fix with USDJPY and especially EURJPY, which both appear to be turning over on me, so in looking to improve my Proverbs 16:3 strategy, I plan to forego entering trades in the future if my primary envelope is not moving away from the direction where contact is made with the candlesticks.
Here is an example of what I'm talking about, though I was unable to document this trade live. Price made contact with the floor of my primary envelope at about 08:00 GMT with the primary, secondary and tertiary envelopes all arguably headed north, which made it okay to enter the trade at 1.3303 (rather than the level suggested by the image). The envelope ceiling take profit target of 1.3332 was hit at 9:15, but given that no red candlestick formed, there was no cause to exit the trade until price began to reverse at 1.3366.
Yep, my lines (above charts) are telling me that the trip north for the yen pairs has almost certainly come to an end. The best I'm hoping for is to exit USDJPY at 103.57 and EURJPY at 115.60 to limit my losses to about 30 pips each.
I exited USDJPY @ 103.655 and EURJPY @ 115.507.
Last edited:
Will Duxon
Active member
- Messages
- 175
- Likes
- 4
Proverbs 16:3 Trading Strategy / Monday Sept 5-6
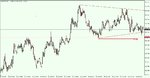
EURUSD looks to have spent the last two days in a mild day-to-day downtrend, resuming the fall it began back around August 18, 2016, so I am regarding this bump to the north as a minuscule pullback offering the faint hope of a few pips profit by shorting the pair at 1.1153 with a profit target of 1.1133.


I was obviously stopped out of the above trade (first chart) by the reaction to disappointing USD ISM Non-Manufacturing/Services Composite numbers, but assuming the prior resumption of a negative trend was legitimate and that today's economic news will not have enough of an impact to reverse the underlying fundamentals--something that I unfortunately am not knowledgeable enough to know for a fact--then today's spike might represent a second opportunity to profit from selling the pair, so I have short EURUSD yet another time at 1.12382 and hope that, worse case scenario, price falls after forming a double top or head-and-shoulders pattern (if not outright).
On the other hand, if it should decide to once again adopt a bullish trajectory--I'm sunk!
Sell EURGBP @ 0.8372
Take Profit @ 0.8358
Target Hit @ 12:45 GMT

Buy AUDUSD @ 0.76249
Take Profit @ 0.7646
Target Hit @ 15:03 GMT

Sell USDCAD @ 1.29103
Take Profit @ 1.28495
Target Hit @ 15:30 GMT

I was having a difficult time "reading" some of my own charts which weren't exactly making sense, but I finally figured out that when I changed the background of my setup from dark to light, I mismatched the ceiling and floor of two of the envelopes. Yikes! The problem has been corrected however, so my charts are once again looking as logical to me now as they were before.
Sell EURGBP @ 0.83779
Take Profit @ 0.83512

This pair (above) is back in my "trade zone" again.
EURUSD looks to have spent the last two days in a mild day-to-day downtrend, resuming the fall it began back around August 18, 2016, so I am regarding this bump to the north as a minuscule pullback offering the faint hope of a few pips profit by shorting the pair at 1.1153 with a profit target of 1.1133.
I was obviously stopped out of the above trade (first chart) by the reaction to disappointing USD ISM Non-Manufacturing/Services Composite numbers, but assuming the prior resumption of a negative trend was legitimate and that today's economic news will not have enough of an impact to reverse the underlying fundamentals--something that I unfortunately am not knowledgeable enough to know for a fact--then today's spike might represent a second opportunity to profit from selling the pair, so I have short EURUSD yet another time at 1.12382 and hope that, worse case scenario, price falls after forming a double top or head-and-shoulders pattern (if not outright).
On the other hand, if it should decide to once again adopt a bullish trajectory--I'm sunk!
Sell EURGBP @ 0.8372
Take Profit @ 0.8358
Target Hit @ 12:45 GMT
Buy AUDUSD @ 0.76249
Take Profit @ 0.7646
Target Hit @ 15:03 GMT
Sell USDCAD @ 1.29103
Take Profit @ 1.28495
Target Hit @ 15:30 GMT
I was having a difficult time "reading" some of my own charts which weren't exactly making sense, but I finally figured out that when I changed the background of my setup from dark to light, I mismatched the ceiling and floor of two of the envelopes. Yikes! The problem has been corrected however, so my charts are once again looking as logical to me now as they were before.
Sell EURGBP @ 0.83779
Take Profit @ 0.83512
This pair (above) is back in my "trade zone" again.
Attachments
Last edited:
Will Duxon
Active member
- Messages
- 175
- Likes
- 4
EURUSD Break Even / EURGBP Loss of 8 Pips
EURUSD is still structured to head south short term even though the longer-term trend is bullish, but I wasn't willing to wait around on the off chance it would actually develop only to end up with a loss, so I exited at break even.

As for EURGBP, the trend has turned north both short-term and longer-term, so I opted to eat about an eight-pip loss.

EURUSD is still structured to head south short term even though the longer-term trend is bullish, but I wasn't willing to wait around on the off chance it would actually develop only to end up with a loss, so I exited at break even.
As for EURGBP, the trend has turned north both short-term and longer-term, so I opted to eat about an eight-pip loss.
Will Duxon
Active member
- Messages
- 175
- Likes
- 4
I expect to see the S&P 500 rise from this level
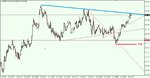
I'm bullish the major indices in that my charts suggest I should anticipate a rise above current levels. For example, I expect S&P 500 futures to head north of 2181.23 not too long from now...


I opted to cash out of SPX500 at 2183.24 (see second chart) given that the push north was extremely weak (the index actually fell some more before it rose) and the intra-day trend is bearish anyway.
GBPUSD has taken an unusual-looking trip south, but in glancing at a lower time frame (the image below is a 15-minute chart) I've concluded there is reason to believe the pair has finished dropping, for the moment at least, so I purchased a NADEX binary option contract with an expiration scheduled for twenty minutes from now, that will close in-the-money as long the pair's value remains above the 1.3322 strike price.


The above 1-minute chart served as evidence that it was likely GBPUSD's apparent turnaround was no head fake, so I purchased yet another binary call option contract that I'm hoping will close in-the-money at expiration an hour from now by remaining above the 1.3323 strike price. (Both trades were successful.)
I'm bullish the major indices in that my charts suggest I should anticipate a rise above current levels. For example, I expect S&P 500 futures to head north of 2181.23 not too long from now...
I opted to cash out of SPX500 at 2183.24 (see second chart) given that the push north was extremely weak (the index actually fell some more before it rose) and the intra-day trend is bearish anyway.
GBPUSD has taken an unusual-looking trip south, but in glancing at a lower time frame (the image below is a 15-minute chart) I've concluded there is reason to believe the pair has finished dropping, for the moment at least, so I purchased a NADEX binary option contract with an expiration scheduled for twenty minutes from now, that will close in-the-money as long the pair's value remains above the 1.3322 strike price.
The above 1-minute chart served as evidence that it was likely GBPUSD's apparent turnaround was no head fake, so I purchased yet another binary call option contract that I'm hoping will close in-the-money at expiration an hour from now by remaining above the 1.3323 strike price. (Both trades were successful.)
Last edited:
sell usdjpy @ 113.34 stop @ 113.55
target 113.18 or better (113.10 & below)
Similar threads
- Replies
- 486
- Views
- 86K
- Replies
- 906
- Views
- 93K
- Replies
- 9
- Views
- 5K
C