if i am correct, about 2 months ago you wrote to me "bin the indicators" now this,Shame On YouFetteredChinos said:hi fella.. BB strategy is essentially trading off 5 min charts...
trade with the longer term trend (ie hourly/30 min charts)
in a bull market, wait for the 5 min price to dip to the lower bolly band.. when RSI is below 30 and then ticks up, we're in business.. bang in a long, and off you go.. exit at your discretion usually at resistance..
does well for scalping trades, and i think i might try it on longer timeframes to reduce the impact of spreads......
bit more forward testing required..
FC
You are using an out of date browser. It may not display this or other websites correctly.
You should upgrade or use an alternative browser.
You should upgrade or use an alternative browser.
Live & Die by the sword....
- Thread starter FetteredChinos
- Start date
- Watchers 25
FetteredChinos
Veteren member
- Messages
- 3,897
- Likes
- 40
i know, i know...i go through phases of using indicators.. they make it easier intraday.. my main method is still EOD, but im toying with intraday in testing as i havent used this BB method before. I have an open mind, and everything deserves a chance.
G-man, yup i got stopped out for -50 last night....back to -5 for yesterday.. i think tighter stops might be the way fwd..
as for today, hourly chart has turned down, so shorts are probably the favoured option today.
FC
G-man, yup i got stopped out for -50 last night....back to -5 for yesterday.. i think tighter stops might be the way fwd..
as for today, hourly chart has turned down, so shorts are probably the favoured option today.
FC
FetteredChinos
Veteren member
- Messages
- 3,897
- Likes
- 40
trendie
Legendary member
- Messages
- 6,875
- Likes
- 1,433
FC,
I have toyed with the Boll-Bands over a couple of weekends.
What I have found is that just because the upper-band is hit, doesnt mean it will bounce back to the lower band.
( even BunnyGirls strat is a bit vague on this )
I have found it hits the upper band, and then goes sideways. I start getting fidgety whether it is going to fall eventually, or carry on upwards, at a slower pace.
But, if you hang about too long, the lower band catches up, and your potential reward diminishes.
( also reverse for when falling )
As an aside, have you noticed how the Pivot Points also act as bands.
Yesterday, for example, the GBPUSD rose and spiked the R-1, and then fell past the Neutral Point, and fell onto the S-1 point ?
EDIT: above line origianlly had R-1; obviously should have said S-1:
🙂
PS: I am toying with the idea of NOT trading if the price is around the Neutral Point. But to take more notice of indicators, such as RSI, or ADX, when it nears the S-1 or R-1 points.
I am basing this on the rather spurious observation, that there appears to be a lot of "bar" noise at Neutral Points, and thus results in whipsaws. And the indicators seem to have lower noise ("clear air" )when at R-1, and S-1 extremes.
Hope the above helps. 🙂
Last edited:
FetteredChinos
Veteren member
- Messages
- 3,897
- Likes
- 40
i know trendie, thats why im trying to trade with the trend where appropriate..
when trading with the trend i try to hold until the outer BB, or more obvious resistance if it is sooner..
when anti-trend, then closing at the middle band is a tad safer..
need to work on stops though. gotta find enough room to wiggle, yet keep things under control..
tricky thing, this intraday, isnt it....
FetteredChinos
Veteren member
- Messages
- 3,897
- Likes
- 40
having thought about this a bit more... perhaps a time based stop could also be appropriate.. if it doesnt start moving your way soon, then get out after say 3 bars? this would stop the R/R getting to silly levels..
hmm..
hmm..
Hi FC
Had a quick glance at the DAX using a 5min chart, RSI of 14 smoothed 3 period and BB 20,2 Expo. Just browsing thru looked pretty good.
I didn't bother checking an hourly chart, just looked to when RSI changed direction outside the 30-70% range off the BB and entered if high/low of that particular price bar was broken. Stop placed under low/high of bar +1 tick.
It's v simple to execute, but how near it should be to the BB to signal a trade is the only thing open to interpretation.....
How it works longer term is of course the big question as I'm not a fan of indicators myself, but it warrants further attention.
Don't know if you want to set up another thread to discuss this particular strategy :?:
Cheers
C
FetteredChinos
Veteren member
- Messages
- 3,897
- Likes
- 40
not sure yet CD, im gonna keep fwd testing it for a while though..
been tinkering with exits, and for this week at least, exiting on the RSI reaching the other level (be it 30 or 70) seems to work nicely when trading in the direction of the prevailing trend..
as for being near a BB, obviously it would make sense to over-ride any entries that dont occur near the BB's, or if the BB's themselves are too close together..
bit discretionary isnt it? 🙂
FC
Bigbusiness
Experienced member
- Messages
- 1,408
- Likes
- 23
I did look at BB's at one time but I didn't have a lot of luck trading them. I also looked at a few alternatives. I use moving average envelopes on longer term charts and did try them with 1min charts but found similar problems to BB's www.stockcharts.com/education/IndicatorAnalysis/indic_MAenvelopes.htm
Another alternative is Sigma bands. They look interesting but I haven't been able to put them in to excel to have a good look.
www.traderiskmanagement.com/faq.php#sigma1
Then there is Keltner channels. There is some fancy software around that costs a lot but doesn't seem to use a lot more than these but I don't want to get in to that argument again www.arbtrading.com/keltner.htm
FetteredChinos
Veteren member
- Messages
- 3,897
- Likes
- 40
cheers BB, i'll have another look.
ta (Y)
ta (Y)
FetteredChinos
Veteren member
- Messages
- 3,897
- Likes
- 40
well i never.. an up-close! 🙂
taken a short on the cash at 5009
longs: 1@5015
shorts 10@ 4969 😱
closed profit: +144
open profit : (430) (humph)
well, a narrow day again today.. bit of fun towards the end, hopefully we'll get a dip tomorrow..
zzzz
taken a short on the cash at 5009
longs: 1@5015
shorts 10@ 4969 😱
closed profit: +144
open profit : (430) (humph)
well, a narrow day again today.. bit of fun towards the end, hopefully we'll get a dip tomorrow..
zzzz
FetteredChinos
Veteren member
- Messages
- 3,897
- Likes
- 40
interesting...seems like someone else has been toying with this idea too....
http://www.strategybuilderfx.com/forums/showthread.php?t=14909
http://www.strategybuilderfx.com/forums/showthread.php?t=14909
FC - I've stated previously that you were very brave to conduct this project publicly with daily announcements of the trades that you had made.FetteredChinos said:well i never.. an up-close! 🙂
taken a short on the cash at 5009
longs: 1@5015
shorts 10@ 4969 😱
closed profit: +144
open profit : (430) (humph)
well, a narrow day again today.. bit of fun towards the end, hopefully we'll get a dip tomorrow..
zzzz
We are now two thirds the way through your timeframe, with 15 sessions to go to the end of the month, and, with the rise in the FTSE by 11.00am this morning (to 5036) the open deficit on your shorts is 670pts or net 649pts including your long. After deducting your banked profit of 144pts your net position is currently 505pts down. I know that the day is not over yet and hopefully your position may improve by 4.30pm !
There is still time for a turnaround by the end of the month but achieving a 600pt gain by then currently seems to be an extremely tall (and unlikely) order - it will be a considerable achievement if you can gain the circa 500pts necessary to reach breakeven. The latter is only likely to occur if the FTSE falls back to around 4980 by then, which is still entirely possible.
Whilst it's "never over until it's over" how do you view the system that you are using so far ?
Do you still believe that it can deliver or have the results to date undermined your confidence in it ?
Are there any changes you might seek to make with the advantage of hindsight ?
You certainly deserve to reach at least break-even and I would be really pleased on your behalf if you can turn this round into some profit by the end of the month.
FetteredChinos
Veteren member
- Messages
- 3,897
- Likes
- 40
well i dont view it as a complete failure as yet.. i am still confident of things working out in the long run.. i thought that 2 months would be enough of a test for any drawdown to be recovered on an EOD system.
still, as you say, there are 15 sessions to go , and it isnt over until the fat lady has cleared her (deep) throat.....
ahem.
onwards and downwards (hopefully)
FC
still, as you say, there are 15 sessions to go , and it isnt over until the fat lady has cleared her (deep) throat.....
ahem.
onwards and downwards (hopefully)
FC
FetteredChinos
Veteren member
- Messages
- 3,897
- Likes
- 40
as for changes to the system, yes, i did spot something after i started this experiment to try to ease the drawdowns somewhat, but i wanted to trade this system "as is".
may be worth continuing a variant of it after june 30th...
will see though. as i am veering back towards FX at the moment.. buying dips, selling rallies with the overall trend is pretty useful IMHO..
still, its all part of the lengthy learning process. every system has its own foibles.. its living with them that is the true test...
FetteredChinos
Veteren member
- Messages
- 3,897
- Likes
- 40
i knew the fat lady wasnt dead yet... 🙂
I'm glad you're right - hopefully the downtrend will now continue.FetteredChinos said:i knew the fat lady wasnt dead yet... 🙂
I went short on the FTSE at 5040 today when the Dow failed to breach 10540 after the open.
FetteredChinos
Veteren member
- Messages
- 3,897
- Likes
- 40
closed long at 5034 for +19
taken a short on the cash at 5030
longs: 0
shorts 11@ 4974 😱
closed profit: +163
open profit : (616) (humph)
i do sincerely hope that this was the blow-off top!
hugely short now. :eek
must trust the system through thick and thin....
more thin than thick at the moment though.
good weekend everyone, im off to drink a very large pint..
fc
neil
Legendary member
- Messages
- 5,169
- Likes
- 754
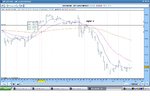
Repent - Return to the fold FC
Can you not be empted back to Forex trading FC.
(Below is a 5 minute chart with support line) 😉
FetteredChinos said:closed long at 5034 for +19
taken a short on the cash at 5030
longs: 0
shorts 11@ 4974 😱
closed profit: +163
open profit : (616) (humph)
i do sincerely hope that this was the blow-off top!
hugely short now. :eek
must trust the system through thick and thin....
more thin than thick at the moment though.
good weekend everyone, im off to drink a very large pint..
fc
Can you not be empted back to Forex trading FC.
(Below is a 5 minute chart with support line) 😉
Attachments
Similar threads
- Replies
- 8
- Views
- 4K