ChattiFX
Member
- Messages
- 66
- Likes
- 4
Hi,
First a bit of background... I've dipped in and out of these forums for years under a few different user names as I'm always forgetting them ha... I've posted a few times mostly asking questions, learnt a lot just by searching and reading what people have to say etc...
"Trading" wise I've tried hundreds of different strategies, mostly spread betting, Trend based strategies, Forex EUR/USD being my main interest. Originally I'd have loved to jack in my job and make a living from this but tbh I never pinned my hopes on it lol. Now I have a well paid job that I enjoy which has given me probably a more relaxed approached. I don't want to say I treat it like gambling but I guess I look on it more as something of a hobby to occupy my over active brain rather than a means to villa in the sun, like I probably, actually definitely, used to dream of... hope that makes sense! :-/
So I thought I would post my current strategy, for comment or interest, I'm not looking for anything back really. I've used it for probably a month or two and when I am disciplined it's profitable and when I get lazy it's not profitable 😉
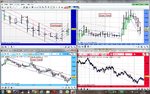
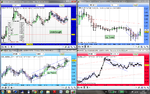
I'd probably label this as a trend/probability based strategy. I'll try to post a picture as that will explain what I am doing better but below is a rough summary.
Essentially I use 4 charts, 1 Day, 1 Hr, 5 Min, Tick. I SB through IG Index so use their charting software which I find very good.
On the 1 Day, 1 Hr & 5 Min chart I use both Bar and Heiki Ashi (HA) to plot price. I use HA to give me my direction.
I then plot Linear Regression (LR) with standard deviation channels (normally set to 2 SD's but I alter this to suit the bar Highs and Low's) along the trends that are highlighted by HA. I realise that prices don't move linearly but I find it helps to give me a channel to trade in.
To determine direction:
Day chart: Down if - Price is above LR. Up if - Price is below LR.
Hour Chart: Direction of HA bars
5 Min: Direction of HA Bars
Tick Chart: Down if - Price is above LR. Up if - Price is below LR
So when all 4 charts are in the same direction I look to open in the direction of the trend.
My opening point is determined by using LR on the tick Chart. I open when the price is close to the LR standard deviation channel levels in the opposite direction to the chart i.e. in a down trend when the price is getting close to the upper standard deviation level of the LR.
Now here is the bit that most people will probably not like and is where my strategy starts to more resemble betting... I open a position with a stop loss and limit that are the same amount of points away from my opening position, but obviously in opposite directions ;-) This value is equal to the distance between the LR and the SD over the longer term trend on the tick chart, so on EUR/USD it is nornally 5-10 points.
Sometimes it's a winning trade and sometimes its a losing trade but I am basically using my trend definition as a way to make it more "probable" that the price will move in my direction so I get more winners than losers and therefore make a profit... :clap:
As I said previously when I am disciplined it seems to be profitable and when I'm not disciplined I make a loss :-( I have no idea if this will work long term or could be scaled up to make BIG money... for now I'm just happy to ride it for a bit and see if I can understand and refine it as time goes by... I'll try to come back in a few weeks and update on how it is working out or not 😕 as the case maybe ha...
Anyway I hope this has been of at least a bit of interest, I'm not saying this is a system that will consistently work, it is early days but I welcome any comments, questions etc...
I'll try and attached a pic of my charts to the post which will hopefully illustrate my ramblings better 😉
Cheers...
First a bit of background... I've dipped in and out of these forums for years under a few different user names as I'm always forgetting them ha... I've posted a few times mostly asking questions, learnt a lot just by searching and reading what people have to say etc...
"Trading" wise I've tried hundreds of different strategies, mostly spread betting, Trend based strategies, Forex EUR/USD being my main interest. Originally I'd have loved to jack in my job and make a living from this but tbh I never pinned my hopes on it lol. Now I have a well paid job that I enjoy which has given me probably a more relaxed approached. I don't want to say I treat it like gambling but I guess I look on it more as something of a hobby to occupy my over active brain rather than a means to villa in the sun, like I probably, actually definitely, used to dream of... hope that makes sense! :-/
So I thought I would post my current strategy, for comment or interest, I'm not looking for anything back really. I've used it for probably a month or two and when I am disciplined it's profitable and when I get lazy it's not profitable 😉
I'd probably label this as a trend/probability based strategy. I'll try to post a picture as that will explain what I am doing better but below is a rough summary.
Essentially I use 4 charts, 1 Day, 1 Hr, 5 Min, Tick. I SB through IG Index so use their charting software which I find very good.
On the 1 Day, 1 Hr & 5 Min chart I use both Bar and Heiki Ashi (HA) to plot price. I use HA to give me my direction.
I then plot Linear Regression (LR) with standard deviation channels (normally set to 2 SD's but I alter this to suit the bar Highs and Low's) along the trends that are highlighted by HA. I realise that prices don't move linearly but I find it helps to give me a channel to trade in.
To determine direction:
Day chart: Down if - Price is above LR. Up if - Price is below LR.
Hour Chart: Direction of HA bars
5 Min: Direction of HA Bars
Tick Chart: Down if - Price is above LR. Up if - Price is below LR
So when all 4 charts are in the same direction I look to open in the direction of the trend.
My opening point is determined by using LR on the tick Chart. I open when the price is close to the LR standard deviation channel levels in the opposite direction to the chart i.e. in a down trend when the price is getting close to the upper standard deviation level of the LR.
Now here is the bit that most people will probably not like and is where my strategy starts to more resemble betting... I open a position with a stop loss and limit that are the same amount of points away from my opening position, but obviously in opposite directions ;-) This value is equal to the distance between the LR and the SD over the longer term trend on the tick chart, so on EUR/USD it is nornally 5-10 points.
Sometimes it's a winning trade and sometimes its a losing trade but I am basically using my trend definition as a way to make it more "probable" that the price will move in my direction so I get more winners than losers and therefore make a profit... :clap:
As I said previously when I am disciplined it seems to be profitable and when I'm not disciplined I make a loss :-( I have no idea if this will work long term or could be scaled up to make BIG money... for now I'm just happy to ride it for a bit and see if I can understand and refine it as time goes by... I'll try to come back in a few weeks and update on how it is working out or not 😕 as the case maybe ha...
Anyway I hope this has been of at least a bit of interest, I'm not saying this is a system that will consistently work, it is early days but I welcome any comments, questions etc...
I'll try and attached a pic of my charts to the post which will hopefully illustrate my ramblings better 😉
Cheers...