Liffe Sugar (white)

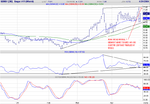
If you want to trade spreads in commodities, you must know the supply/demand of the physical for the period under consideration and who is holding the commodity. Additionally, technical factors such as a spot squeeze can come into play. There are all sorts of reasons a spread might move. Shipping problems, warehousing capacity, freight strikes.
Carry is just the cost of warehousing or storage + interest. The contract spec will state where the commodity can held. ie designated warehouses.
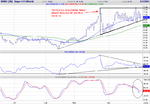
Re manipulation, I was referring more to the fact that NY does larger volume and has bigger open interest, so although it is still subject to spoofing, you should get a less choppy ride.


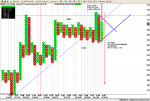
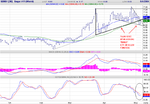
I was just having a nose around and yesterday's volume was London Whites 8774 NY11 Raws 84087.
Open interest, London 59308 NY 275343
I know which one I'd rather be trading.
 
Last edited:
Firstly apologies for the inaccurate title of this thread - Both sugar contracts can be discussed here.

I am now concentrating on Sugar #11.

I'm still bullish -

Trendline support held, and we now have a Rising Wedge forming - should be a long-term reversal pattern IMO,

Objectives 830 from the breakout above 730...

Ultimately 895-900.

Yes it's volatile, can be difficult ,but good entry off support such as today with a strategic stop can be very effective.
 

Attachments

  • caercxur.png
    caercxur.png
    30.8 KB · Views: 313
Last edited:
Good move for the day. Chart looks appealing but needs to break-out at 730. However, by then its not a low risk entry any more. Spreads have come in a bit which supports the price action.
Nice tweezer bottom on the daily chart.
Interestingly, my broker sold SB N yesterday at market and recommended his clients to do so at todays' open (his clients were hosed!). Before he had a stop at 666, which in fact it never touched. No great show!

Dave, As for the title of thread, you can probably as the starter of thread change the title in "Sugar".
 
Sugar P&F chart

Couldn't resist charting SB N in PNF (tomorrow I am doing an TA exam which includes the subject, wish me luck!)

PNF confirms DaveT observation that 730 break warrants a long position (albeit with 30-65cts risk).

Upside target under vertical count is 860 while downside from here could be as much as to 580!!

Dark blue 45 degree lines show that:
Below down sloping, bears remain short &
Above upward sloping libe, bulls remain long
In summary, a nasty and bloody fight for supremacy
 

Attachments

  • sugar pnf.png
    sugar pnf.png
    180 KB · Views: 298
JULY CSCE SUGAR -

Rising wedge or ascending triangle?

Either way,the objective from the breakout above 725-730 is intinally the same - 830.

Need to see above 730 though.
 

Attachments

  • CA0Djuly sugarx.png
    CA0Djuly sugarx.png
    30.2 KB · Views: 294
DaveT said:
JULY CSCE SUGAR -

Rising wedge or ascending triangle?

Either way,the objective from the breakout above 725-730 is intinally the same - 830.

Need to see above 730 though.

Sugar tumbled below the previous low of 6.74 on back of fund liquidiation (source sucden). Battle between long term longs and short shorts has begun in earnest and might provide with some more volatile weeks.

Seasonally, May 4th - May 14th is bullish producing on avg about 30cts. Nevermind that this trade has worked 15 out past 15yrs, the 1st day of this trade recommendation did not start well -24cts. Is the seasonal late to start or is cyclical liquidation just too strong?
We'll know before long. For now, I am sidelined (other than a "small" bl..d. jul-mar05 spread which has widened to -66cts and I just cannot make my self to cover - where's the discipline? :eek: )

Dave, when would you assume that the ascending triangle would have failed?
 
bgold said:
Sugar tumbled below the previous low of 6.74 on back of fund liquidiation (source sucden). Battle between long term longs and short shorts has begun in earnest and might provide with some more volatile weeks.

Seasonally, May 4th - May 14th is bullish producing on avg about 30cts. Nevermind that this trade has worked 15 out past 15yrs, the 1st day of this trade recommendation did not start well -24cts. Is the seasonal late to start or is cyclical liquidation just too strong?
We'll know before long. For now, I am sidelined (other than a "small" bl..d. jul-mar05 spread which has widened to -66cts and I just cannot make my self to cover - where's the discipline? :eek: )

Dave, when would you assume that the ascending triangle would have failed?


Bgold -

Stricly speaking, 2 closes below the trendline....Also see the 40-day MA was breached yesterday .

Not good techniclly, however it has not gapped lower on the open today. You need wide stops for this at the moment - especially with SB.

Did you know the new ETHANOL NYBOT contract starts trading tomorrow (friday)? Also it is 'Sugar Week' in New York next week- for what it's worth?
 
July sugar #11 - last trade 680. Pre-settlement.

Looks like it closed on the trendline and back above 40-day MA.

Two-day reversal? Also formed a falling wedge within the ascending triangle.

Incdicators are not bullish, but becoming oversold.
 

Attachments

  • CAGjuly sugar.png
    CAGjuly sugar.png
    31.9 KB · Views: 296
Last edited:
Nice tweezer bottom on the daily chart! I read on sucden site that there may even be some trade buying and they mention rumours about Russia. Interestingly, the spreads cam in yesterday. Even the Nov04 - March 05, although still below trend line.

Great new layout but I do not seem to understand how to attach charts. The manage attachments button does not work!!!! :( Can somebody advise?
And, how does one ensure e-mail notification? :confused:
 
Bgold have you checked your settings in My User Options?

Attachments are downloaded as before, but with the option of multiple attachments.
They must be in the stated formats though.
 
Thanks for advice but I am afraid still can't figure it out. Which option should one have ticked in User Option section. Basically, I can't find the "browse" function anymore just "manage attachments" which doesn't do anything?????
 
While we watch the bulls and bears battle it out in the Sugar, check out :

www.sugaronline.com

A good one-stop shop for all news, analysis and fundamentals about world sugar.
 
Seen the site, but it seems that if you want the news one needs to apply to the SugaronlinePlus (and pay a fee of $275 pa !!)

They were quick to follow up to see if I wanted to sign up for the upgrade!!

Did you sign up?
 
Bgold - re. attatchments.

1) Type your post/reply as usual.
2) Click 'Manage attatchments bleow the post window.
3) Click the first of the 3 Browse buttons
4) Search for your file, double click as usual and ensure the path appears in the field to the left of the BROWSE button.
5) Click UPLOAD and wait for competion.
6) Close the Window when prompted.
7) SAVE CHANGES/POST REPLY etc.
8) Wait for post to be added
9) Check the POST!
 
Many thanks for explanation.
Unfortuinately step 2 doesnot seem to work (consistently). When cliking it just doesn't respond. Will have to take up it with Sharky.
Thanks
 
bgold said:
Many thanks for explanation.
Unfortuinately step 2 doesnot seem to work (consistently). When cliking it just doesn't respond. Will have to take up it with Sharky.
Thanks


Try this:

1) COMMUNITY at top of screen
2) Click MY USER OPTION
3) scroLL down to 'THREAD DISPLAY OPTIONS'
4) Ensure 'SHOW IMAGES' is ticked.

Failing that COME ON SHARKY!!
 
Sugar

DaveT said:
SUGAR gets very little coverage here - so i'll kick off with my analysis of WHITE SUGAR (LIFFE).

Fundamentals - (RAW)
------------------

World raw sugar production DOWN
- 03/04 est 146.8 (vs 149.9)

Global consumption UP
- 03/04 est. 143.2 (vs. 139.4)

Supplies hit by expected drop in output in India, Russia, EU, Thailand., due to unfavourable weather.

Lowest Stocks-to-use ratio in 6 years. Small global deficit (270,000 MT) forecast. Chinese demand to follow?

Fundamentals (WHITE)
-----------------------------

Tightening deliverable supply scenario.
Expected demand increase.


TECHNICALS - I'll post 3 charts.
----------------

DAILY CHART -

(MAY04) has shown a steep rise since the new year.
A nice saucer/rounding bottom has formed.
The London market is showing greater strength than CSC (NY).
RSI wedge breakout is at overbought, so could fail - correction due?

Also note the head and sholders bottom in the middle of the saucer. Looks like a good buy after it corrects.
 
The "Manage Attachements" causes a pop-up window to appear - please make sure you don't have a popup killer working on the site, otherwise you won't be able to see it! And it will simply appear to not work. I'll add a note next to it, to remind people about this.
 
Sharky said:
The "Manage Attachements" causes a pop-up window to appear - please make sure you don't have a popup killer working on the site, otherwise you won't be able to see it! And it will simply appear to not work. I'll add a note next to it, to remind people about this.

Sharky, thanks for response. It was indeed the "script blocking" function in Norton Firewall which prevented me using the manage attachments function.
Thanks for advice.

I am, however, not sure whether it is a good idea to have "script blocking" disabled? I am advised by both Norton and my IT support that it would be better to have this feature running.
rgds
 
Is Sugar rally the real thing?

July sugar shows nice rally but how much is real buying? Spreads have improved a bit (see attached chart) but not enough to convince me that this rally will go to new highs.

I can also count the wave correction to be over at recent bottoms with sugar getting ready for a wave 3 rally to new highs.

The Sugar July/Oct bull spread is seasonally strong between 16 may and 28June on average delivering about 27cts (3 out of 15yrs). Thusfar it rallied just short of 20cts.
If this rally were fundamental I would have expected this spread and others to have tightened before the July contract kicked off. That didnot happen. What am I missing?

Keen to hear your fundamental and/or TA views?
 

Attachments

  • sugar spread.png
    sugar spread.png
    135.5 KB · Views: 308
Top