You are using an out of date browser. It may not display this or other websites correctly.
You should upgrade or use an alternative browser.
You should upgrade or use an alternative browser.
DaveT, Very interesting charts and analysis. I am also bullish on sugar but have to admit went flat yeterday after tightening stop to Fridays' close at 697. In hindsight not a bad move, let's hope i won't regret.
Having see the havoc in March, i decided to get out of 1/2pos at 701 and was stopped out on 696 for remainder.
My reasoning:
1. I was long full position from 634 and had added another 1/2position at 7.02. Range trading gave me the creeps (as flags do), and
2. Fridays' COT report showed a further increase of Large spec longs vs -122k for Commercials.
3. April rally failed to confirm March highs and various indcators do not point to imment strength.
4. Sugar bull spreads do not point to strength (may/July tightened a little but Jul04-Mar05 has gone down to -26 from -10 a week ago.
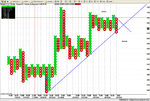
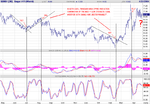
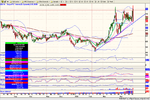
5. P&F (3box) is just breaking through bullish support (see chart).
I wouldn't be surprised if we get some more volatile trading in next few trading sessions.
Having see the havoc in March, i decided to get out of 1/2pos at 701 and was stopped out on 696 for remainder.
My reasoning:
1. I was long full position from 634 and had added another 1/2position at 7.02. Range trading gave me the creeps (as flags do), and
2. Fridays' COT report showed a further increase of Large spec longs vs -122k for Commercials.
3. April rally failed to confirm March highs and various indcators do not point to imment strength.
4. Sugar bull spreads do not point to strength (may/July tightened a little but Jul04-Mar05 has gone down to -26 from -10 a week ago.
5. P&F (3box) is just breaking through bullish support (see chart).
I wouldn't be surprised if we get some more volatile trading in next few trading sessions.
Attachments
Seasonal tailwind may cause break-out!
Dave, thanks for reminder. I understand that many trendfollowers remain bullish above ~666
What should be the entry level? Above the flag at 693? Or nearer to recent high of 711?
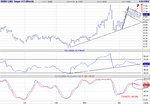
Interestingly, according to MRCI, buying Jul Sugar on 4May and selling 16May would have been profitable 15 out of past 15 yrs (see chart).
For now calendar spreads do show some signs of bottoming but only very marginally. fyi I bot initial position in bullspread Jul04-Mar05 at -37. With (mental) stop at -50
Dave, what is your take on the signals (MACD & Stoch) you posted sometime ago? Sugar doesn't look like one (I am using the chart regularly 🙂)
Anyway, it just feels that SB has another leg up targetting 775+!
Dave, thanks for reminder. I understand that many trendfollowers remain bullish above ~666
What should be the entry level? Above the flag at 693? Or nearer to recent high of 711?
Interestingly, according to MRCI, buying Jul Sugar on 4May and selling 16May would have been profitable 15 out of past 15 yrs (see chart).
For now calendar spreads do show some signs of bottoming but only very marginally. fyi I bot initial position in bullspread Jul04-Mar05 at -37. With (mental) stop at -50
Dave, what is your take on the signals (MACD & Stoch) you posted sometime ago? Sugar doesn't look like one (I am using the chart regularly 🙂)
Anyway, it just feels that SB has another leg up targetting 775+!
Attachments
Interesting seasonal , BGold....
To trade a possible breakout, you SHOULD (technically) wait to see at least 2 days 'clearance' to minimise the chance of trading a false break.
Or wait for a return move.
I have to admit that sometimes I break this rule, if the weight of the evidence' seems strong to me.
Re. MACD + Slow STOCH, I agree the signal is not set up right here. It seems to be better for siganalling the bigger trend changes, such as at the start of the FEB-March rally.
No one method, set of indicators or pattern is going to give 100% reliability. I would always look for confirmation in basic price action (eg trendline break, reversal pattern etc.) before trading off a momentum combination.
As Traders,we're deaing in probabilites. (ie, trading set-ups we feel have a high PROBABILITY of follow-through.)
Last edited:
Why are calendar spreads not confirming the sugar break-out?
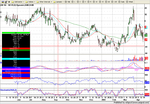
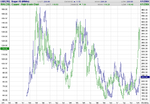
Super rally in July Sugar. All the way from 675 lows to 711 in just 2days. I didnot participate 🙄 . Reason? Probably analysis paralysis! I am long the Jul-March05 spread and see that this spread has only marginally come-in and so has the Jul-Nov SBN-SBV (see chart).
These spreads seem to have been in a much more pronounced bear trend than SB N4.
What am I missing? Can somebody explain or do these spreads show that this rally is going to be a false break-out, once again triggered by funds and smal specs while the "big" boys (Commercials) are waiting for the kill?
Again, i didn't like the COT and neither the fact that just about everybody seems to be of the opinion that sugar is going to rally.
(i'll probably going to regret having missed the fun 😱 )
Attachments
Bgold -
I don't follow the spreads so I don't feel qualified to comment on that score.
As for COT, I observe the report, but don't base my trading decisions on it at all really. Longs can get longer, shorts can get shorter...
Commercials are always positioned opposite to the funds and specs. They are long-term hedgers. We are looking for (relatively) short-term profits.
I just use my own TA rules of entry/exit/re-entry, with an eye on the fundamental developments and S/D picture.
Not infallible, ofcourse.
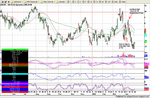
I think such violent swing moves are an inherent characeristic of SUGAR.
Technically, was it a sweeping key reversal?
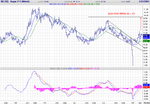
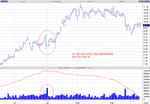
Yet , to put it into context, look at the chart of OCT 2000 SUGAR below.
This was the last sharp multi-month rally in sugar.
Note a similar, sweeping reversal in July 2000. The market continued on it's merry way to 11.00 though.
Technically, was it a sweeping key reversal?
Yet , to put it into context, look at the chart of OCT 2000 SUGAR below.
This was the last sharp multi-month rally in sugar.
Note a similar, sweeping reversal in July 2000. The market continued on it's merry way to 11.00 though.
Attachments
July Sugar made new highs and than a crash (fascinating, although it cost me a bundle on my long SB N-H5 which discount widened to -50).
Has the sugar rollercoaster finished? Unlikely, hedgefunds and small specs will have to suffer more pain before the next rally towards 800 can happen. I read that Jul sugar gets seasonal backwind in early May.
DaveT, I would agree with your Long Term view but is difficult to trade. See what happened those hedgefunds who according to Sucden report bought 10,000 contracts in yesterdays' rally. Many $millions of investor funds have disappeared in the price action of past few weeks. That will leave deep scars.
Would anyboday know how one calculates the carrying charges for Sugar? Courtney Smith states in his book that this is difficult and the market tends to ignore these charges.
If so, the fair value for sugar spreads should be near financing costs, implying that the spread Jul-March05 (~8 months) currently trades at an irrational discount.
Now, I am still rookie but experienced enough to know that that ain't be the case. 🙄
Can anybody shed light or point in right direction?
thanks
I haven't followed sugar for quite a while now but I know that a few trade houses used to control the London market. This looks like a classic of the trade manipulating the funds. Check out the open interest to see what happened.
If you insist on trading sugar, I would suggest you'll get a smoother ride in NY.
If you insist on trading sugar, I would suggest you'll get a smoother ride in NY.
Thanks for reply.
I fully agree with you on comment that trade manipulated the funds. For exactly those reasons I decided to stay out other than that I put on a Jul04-March05 bull spread on.
COT showed a substantial increase in "trade" shorts.
I do also trade NY market but is just as volatile (NB I know header of this thread is not perfect but at least all posts on sugar are kept together).
Any thoughts about Sugar carrying costs?
Any thoughts about Sugar carrying costs?
Good point. Im going through Courtneys book at the moment - and can see why CC are so important (but will probably need a re-read to get the full grasp - Doh!)
Where do you guys get the figures from? Broker/website/other?
Are their industry standard figures, or is that the secret in spreads - accurately calculating the CC figures?
Surely the CC will vary from producer/consumer depending on who/how they use to store and finance the commodity. Therefore, surely an aggregate figure would be more useful.
Your guess is mine on CC's. Some are mentioned in Courtney's book. I guess they do not change that much but insight can clearlyt help establishing low(er) risk entries while using other TA methods to establish entry , targets and stops.
I will enquire with my broker but do not have high hopes.
I will enquire with my broker but do not have high hopes.
Similar threads
- Replies
- 1
- Views
- 54K