Liffe Sugar (white)

DaveT

Well-known member
Messages
434
Likes
6
Liffe Sugar (white) / CSCE SUGAR #11

SUGAR gets very little coverage here - so i'll kick off with my analysis of WHITE SUGAR (LIFFE).

Fundamentals - (RAW)
------------------

World raw sugar production DOWN
- 03/04 est 146.8 (vs 149.9)

Global consumption UP
- 03/04 est. 143.2 (vs. 139.4)

Supplies hit by expected drop in output in India, Russia, EU, Thailand., due to unfavourable weather.

Lowest Stocks-to-use ratio in 6 years. Small global deficit (270,000 MT) forecast. Chinese demand to follow?

Fundamentals (WHITE)
-----------------------------

Tightening deliverable supply scenario.
Expected demand increase.


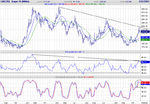
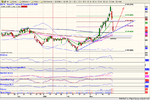
TECHNICALS - I'll post 3 charts.
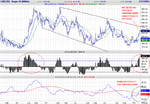
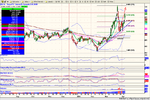
----------------

DAILY CHART -

(MAY04) has shown a steep rise since the new year.
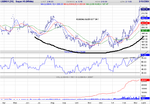
A nice saucer/rounding bottom has formed.
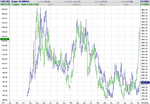
The London market is showing greater strength than CSC (NY).
RSI wedge breakout is at overbought, so could fail - correction due?
 

Attachments

  • sug daily2.png
    sug daily2.png
    39 KB · Views: 973
Last edited:
WEEKLY CHARTS
---------------------

Moving averages crossed and pointing up.

Momentum studies signal new uptrend - I've used SLOW STOCHASTIC (4,26,52) - note crossing.

Commodity Channel Index is firmly above 100 - V. Bullish - similar to early 2000 rally ? (see highlighted areas)

A broadening channel has formed - A break of this would signal higher levels.
 

Attachments

  • weekly sugar3.png
    weekly sugar3.png
    47 KB · Views: 1,167
MONTHLY CHART
--------------------

For the monthly , I've compared LIFFE SUGAR to HG COPPER.

Just to highlight the APPARENT broad correlation.

It really shows how the commodities often follow eath other in MACRO-ECONOMIC TERMS.

Will SUGAR experience a strong bull market within 1-2 years, following COPPER as in the historical past?
 

Attachments

  • sugar+copper.png
    sugar+copper.png
    17.7 KB · Views: 1,326
Dave T - Fascinating correlation, I never noticed that before . Would be a great spread by the look of it. I wonder what the relative contract ratio is.
 
DaveT,

slightly off topic, but how did you discover the apparent correlation between copper and sugar? was it just lots of research/trial & error?
Do you know the differance between sugar #5 and #11. These are both quoted on Finspreads for us sb'ers.

Thanks Stephen
 
scpope -

Sugar #5 is WHITE SUGAR (refined) - traded on LIFFE, in London.

Sugar #11 is RAW SUGAR (unrefined) , traded on CSCE, New York.

Both types are produced from CANE or BEET.

Sugar CANE represents 60-70% of total production.
Sugar BEET represents about 30-40% of production.

Largest Producers (of Cane & Beet) :

1) Brazil
2) India
3) EU, China, US , Thailand, Austrailia

Largest Consumers :

1) India
2) EU
3) China
4) Brazil, USA, Russia, Mexico, Indonesia.

Regarding the SUGAR/COPPER correlation: I am always comparing & contrasting different commodities/securities/markets,etc.

If you look at enough charts you will begin to intuitively see the relationships; positive, negative, or neutral.

I
 
David,

Thanks for the reply. I am probably guilty of not looking at charts over a long enough time frame. Frequently I find that good looking trades from daily charts look less appealing on weekly charts. Must learn to also look at monthly.

Last July I went for a job interview assessment day. On the same day their was an engineer who had just been made redundant from a sugar processing mill in London. He was explaining that this was due to the imminent deregulation of the European sugar market. ie. the removal of subsidies or trade barriers or similiar (details foggy due to time not age!) making imports cheaper and hence processing being reduced inside EU. Do you know if this has happened yet. I imagine it would have a positive effect on futures price, if it lead to international prices rising.

Stephen
 
I could not see a similar relationship between CSCE sugar and Comex Copper. maybe I am not manipulating the figures correctly. Dave T what software are you using to get these charts?
 
twalker -

I'm simply using FutureSource.com Premium FREE charts, copied and pasted to My Pictures, and edited with Paint application.

I agree the COPPER correlation doen't appear with CSCE Sugar.
I just observe the markets and record my findings.

Don't always look for the whys and wherefores....

scpope - interesting re. EU sugar deregulation.
 
Re COMEX COPPER/ CSCE SUGAR -

Maybe you need to plot CSCE SUGAR #11 on a different scale to illustrate a similar relationship as LIFFE SUGAR/COMEX COPPER ?
 
DaveT, Good call on sugar. Hope you are long. Hope you are long. I am playing Comex July contract at 596. Sentiment is strong. Not only are we up 3.5% in May contract but also calendar spreads are coming in rapidly. Good sign for more positive action.
 
A BIG PLUNGE IN SUGAR TODAY -

LIFFE WHITE SUGAR -

See on the weekly chart how DOWNTREND RESISTANCE has been met - price bounced down off the trendline to form a spike bar.

A break of this trendline, without recrossing, is needed to confirm a new long-term bull market, IMO.

Based on my COPPER/SUGAR monthly comparison, it should only be a matter of time.
 

Attachments

  • sugar weekly-new.png
    sugar weekly-new.png
    47.3 KB · Views: 474
Thanks for chart. I should have seen it before yesterdays' collapse. Was long SB N4 from 5.96, sold 1/2 position at open at 7.03, rest was stopped out 6.78, which I fear I will regret. We'll see. Yesterday may just have been a sharp correction.
May Sugur bounced off M-line of 11 March and closed near .382 retracement from 554 lows in Feb. I find the July chart more confusing; appears to have more downside potential.
 
Dave T

Perhaps you know the answer to this question:

How much of the recent (1yr) price increases in base metals like copper is due to the weakness of the dollar? Is this the most important factor or is Chinese demand more important?

Are base metals prices markedly higher on an indexed basis?
 
SB N4 bounces off support (?)

Perhaps bit of a gamble but I am again long 1/2 position SB N (July) at 6.34. Stop at 6.05 (?)

Thusfar price held above support which I see as
a. .618 retracement of rally from the lows,
b. the M-line of 11 March, and
c. trend line (see chart).

Stops can be set at bottom of candle or perhaps a 75+% retracement of rally at 6.05. Problem is that wave 2 can almost fully retrace wave 1 before wave count becomes invalid.

I choose 6.05 which quite wide 5% (still less than todays' move) because I suspect the trade (market makers/insiders) to go for all obvious long stops (eg create some space below bottom long candle).

Perhaps better to wait for upside confirmation which requires trading back to 660-670's closing gap/falling window.
 

Attachments

  • sugar 26mar.png
    sugar 26mar.png
    167.5 KB · Views: 369
Sugar bouncing back up!

This trade is working out well (unlike the Cocoa which collapsed).

SB N4 held at support and bounced nicely up from the 0.618 retracement of rally to the 7.25 high. Now at 6.93
Elliot wave count points to a top above 7.25

Long from 6.34, initial stop at 6.05, now raised to 6.67 (just below the rising window/gap). Will review stop level again for tomorrow.
See updated chart
 

Attachments

  • sugar.png
    sugar.png
    243.1 KB · Views: 343
Nice call.

Was there a reason for the sudden steep climb in March to 720, prior to the price dropping back to its' trendline?
 
July Sugar in P&F chart looks very bullish

For what it is worth, I couldn't resist charting sugar in PNF.
According to theory, as long as prices remain above the 45degree (fat) line, Sugar remains bullish.

Interesting to see that prices bounced exactly up from the 45degree support line. This would imply that sugar remains bullis for as long as prices remain above 635 (which is a too much risk for my stop), but a level to consider playing sugar from long side.

As for ultimate PNF targets (eg only buy & hold situations, which is difficult in futures with only a few months till expiry)
vertical count: 14crosses x 3box reversal chart x 0.05 = 2.10
horizonal count: 11 boxes from previous breakout x 3 x 0.05= 1.65
gives:
Vertical count: 6.30 + 2.1 = 8.40
Horizonal cnt: 6.30 + 1.65 = 7.95

Neil, I believe there were some demand issues (possiblky related to China) but main reason was a massive buying by hedgefunds who subsequently were shaken out by commercials (and probably locals) who shorted above 7.00. My understanding is that fundamentals are very good for sugar but it is a tricky market to play, so staying with main trend is probably best advice. ;)
 

Attachments

  • sugarpnf.png
    sugarpnf.png
    157.3 KB · Views: 349
July04 CSCE Sugar has been trading sideways for the past few sessions.

I see a possible bull flag formation( breakout objective 780), but a test of support may come first (?)

Long-tem , the weekly shows good upside potential.

See my charts below.

BGold - is your P & F 45' line holding? (basis July?)
 

Attachments

  • july04 sugar.png
    july04 sugar.png
    28.9 KB · Views: 301
Last edited:
Top