Learning to trade from scratch.

Yes I meant resistance, thank you.

As for connecting candles, in my opinion it's not going to be 100% accurate. This is because of the buying or selling forces in action. There may be automated orders that get hit causing a some flux of the price, or some other factor. But if its in within 5 or 10 pips then your stop loss should cover that. Give your trade a chance.

I have my resolution set on my 22 inch monitor to high, so that's probably it. I will try to lower it on my next image.


I see that you have posted 2 charts ( for some reason they are bigger than my browser window) and I cannot see what you are doing to determine support and resistance. You are not connecting candle close or candle extremes, so how do you determine S/R lines.
In your last chart you add text that price broke through this support line, do you mean resistance?
 
Yes I meant resistance, thank you.

As for connecting candles, in my opinion it's not going to be 100% accurate. This is because of the buying or selling forces in action. There may be automated orders that get hit causing a some flux of the price, or some other factor. But if its in within 5 or 10 pips then your stop loss should cover that. Give your trade a chance.

I have my resolution set on my 22 inch monitor to high, so that's probably it. I will try to lower it on my next image.

I agree that connecting candles will never give 100% accurate support and resistance levels - if they did, everyone would be rich.
But your support and resistance lines seem to be random. They are not based on highs, lows, candle close or anything. They just seem to be lines vaguely following market direction. The horizontal resistance in the GBPJPY chart wasn't at a swing high, and had 3 candles above it. It just doesn't make sense to me.:confused:
 
I looked at the chart you are referring to and the green line there was my take profit line. I didn't have an actual horizontal line drawn there, just a circle pointing out the resistance area. So that is my mistake. I should have drawn a line.

But other than that I am unsure how my other S/R lines are random. Check out my blog for more examples and I will be glad to discuss them with you.


Good luck with your trading.

I looked at a few pages of your blog, sorry but I wasn't going to read it all.
It seems to me that you have no consistent method for drawing support and resistance lines. They are vague and have no real validity.
Your pre-trade chat is just as vague and you make claims to profiting after the fact.
And what is a GEPPY?
 
No worries.

Obviously you are new to forex trading so I would suggest visiting babypips.com and going through the "school" there. On my blog I write of things that may be above some beginners, so for that I apologize.

S/R is a point where bulls ( that is, people who believe the price is worth more) and bears ( that is, people who think the price is worth less) have conflicting views (resistance). Visually, on a technical chart you will see the price struggle to get past a certain price point, and if the bears or bulls win, you will see that that price point now becomes a place where it doesn't go below it or above it (support). So really, there is no method, it JUST IS S/R.


p.s GEPPY is slang for GBP/JPY (google)

I looked at a few pages of your blog, sorry but I wasn't going to read it all.
It seems to me that you have no consistent method for drawing support and resistance lines. They are vague and have no real validity.
Your pre-trade chat is just as vague and you make claims to profiting after the fact.
And what is a GEPPY?
 
No worries.

Obviously you are new to forex trading so I would suggest visiting babypips.com and going through the "school" there. On my blog I write of things that may be above some beginners, so for that I apologize.

S/R is a point where bulls ( that is, people who believe the price is worth more) and bears ( that is, people who think the price is worth less) have conflicting views (resistance). Visually, on a technical chart you will see the price struggle to get past a certain price point, and if the bears or bulls win, you will see that that price point now becomes a place where it doesn't go below it or above it (support). So really, there is no method, it JUST IS S/R.

p.s GEPPY is slang for GBP/JPY (google)

Google "Guppy" and you may get more hits. I've never seen anyone refer to GBPJPY as "Geppy"
I'm not new to trading, but relatively new to Forex and I certainly saw nothing on your blog that was above the basic beginner.
I attach some images to show you how to draw S/R lines

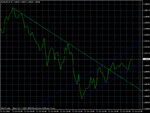
The first image is a common method and the candles close is used to draw the lines. This is easier to do if you switch to a line chart. The green line is resistance that has now been broken This could possibly now act as support should the price move downward.
The lower blue line is the support line and the other blue line is an equidistant channel
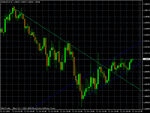
The 2nd image is the same chart switched back to candles.
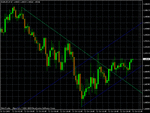
The 3rd chart the lines are drawn using the highs or lows of the candles

Both of these methods are valid
Your method however appears to consist of drawing a line in the direction of the trend not relating to any valid highs or lows.

It's quite common in this forum for new posters to appear with links to their blog that gives the impression that they are making loads of pips. They suck in the gullible newbies and eventually try to hit them for money to get in on their system with live trading signals etc. Some people, once they realise that they are unable to earn money at Forex trading try to become a teacher try to get their losses back by preying on others.
I'm not saying that this applies to you, but my suspicions were aroused by your first post as it is typical of so many blurbs that are designed to entice the newbie into handing over their money.

It's a matter of personal preference, but I prefer to use the candle close method
 

Attachments

  • 15 minute sr.gif
    15 minute sr.gif
    18.6 KB · Views: 198
  • 15 minute sr candle.gif
    15 minute sr candle.gif
    22.4 KB · Views: 215
  • 15 minute sr candle extremes.gif
    15 minute sr candle extremes.gif
    22.8 KB · Views: 214
Google "Guppy" and you may get more hits. I've never seen anyone refer to GBPJPY as "Geppy"
I'm not new to trading, but relatively new to Forex and I certainly saw nothing on your blog that was above the basic beginner.
I attach some images to show you how to draw S/R lines

The first image is a common method and the candles close is used to draw the lines. This is easier to do if you switch to a line chart. The green line is resistance that has now been broken This could possibly now act as support should the price move downward.
The lower blue line is the support line and the other blue line is an equidistant channel
The 2nd image is the same chart switched back to candles.
The 3rd chart the lines are drawn using the highs or lows of the candles

Both of these methods are valid
Your method however appears to consist of drawing a line in the direction of the trend not relating to any valid highs or lows.

It's quite common in this forum for new posters to appear with links to their blog that gives the impression that they are making loads of pips. They suck in the gullible newbies and eventually try to hit them for money to get in on their system with live trading signals etc. Some people, once they realise that they are unable to earn money at Forex trading try to become a teacher try to get their losses back by preying on others.
I'm not saying that this applies to you, but my suspicions were aroused by your first post as it is typical of so many blurbs that are designed to entice the newbie into handing over their money.

It's a matter of personal preference, but I prefer to use the candle close method

I like your charts Gumrai my friend,

very professional, clear and concise

"seven9ine" I admire your cause my friend, but what you need to do is post your live trades with entry, exit and stop loss for all to see so that the Newbies can learn from your execution skills.

That is what I do at my thread aimed to help newbies on trading currency, indices and commodities. I invite you to join us and share your analysis as we already have a good community
http://www.trade2win.com/boards/uk-...alls-ftse-dax-s-p-aimed-help-new-traders.html

Gumrai certainly has a valid point, your trend lines do look a bit wayward

Any newbie can pick up a book and draw trend lines, learn fibonacci etc etc....but how do they apply it in a live market.

the best way to show them is by posting your trades live .........they can then work backwards and learn why you took the trade...the best way to learn!!

Gumrai is right anybody can claim to make profit after the event, If you post live trades then people will judge you from your results and no one can accuse you of taking advantage of Newbies.

Gumrai is correct as there are a lot of sharks out there..........hence the reason why i set up my thread.

There are a lot of people that can talk the talk, and walk the walk........I challenge any one who wants to help people and show them there so called successful method to post live trades for all to see and then we can judge them by there results. Its the best way ........

I trade based on price action alone, no indicators
 
Last edited:
I will look forward to your live trades next week seven9ine my friend ......

I update my daily analysis on benzinga.com
wallstreet1928 | Benzinga.com

I have written an article and produced a chart of

EUR/USD.........
GBP/USD.....

you might be interested to take a look my friend
 
I will start posting my trades clearly. I understand the shark comment and I wholeheartedly agree.

Thanks for the positive criticism.
 
An interesting thread. With all due respect to seven9ine, who has come here trying to help, much appreciated but One must be very careful in choosing their words when trying to refer respected members to a beginners "school" on a certain website, without first ascertaining their level of expertise. GumRai, proved otherwise.

Its not the amount of technical knowledge that you have, but how many dollars you have accumulated in your trading account at the end of the day. Your method can be a few connecting lines here and there, or a chart with so many indicators that it looks like, spaghetti.

It's very easy for anybody to prove that their system/method makes money. Just go live like on this forum, and make your trades for everybody to see, with entries/exits stop loss etc.

Seven9ine, has enlightened us with a lot of trading wisdom, wishing him the best of luck with his trading.
 
Last edited:
Entry for AUDUSD

Hi Greg,

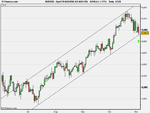
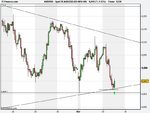
Would be interested in how you would play a possible long on the AUDUSD, which has been trending nicely on the daily and is now at the bottom of the channel. Looking at the hourly chart seems to be showing a bullish engulfing bar off of a minor support level, what do you think?

Cheers, Paul.

Spot FX AUD_USD (03-NOV-09).png

Spot FX AUD_USD (03-NOV-09) 1h.png
 
Hi Greg,

Would be interested in how you would play a possible long on the AUDUSD, which has been trending nicely on the daily and is now at the bottom of the channel. Looking at the hourly chart seems to be showing a bullish engulfing bar off of a minor support level, what do you think?

Cheers, Paul.

As there have been no posts from the OP for 2 weeks, it is quite possible that his intentions were suspect.
Your charts and comments give the impression that you are already a more capable trader than Seven9ine, so maybe he should be asking YOU for advice :)

Good luck
 
Top