Best Thread learning to read price action with p/f charts

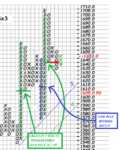
quite often ...there is no real need for a p/f chart
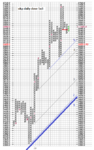
this is a line dot chart
the dots are the close
in this chart it is 5 min gld
the same as p/f chart that plots the close
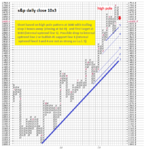
trend today shows up nicely

Hi Dentist007.
I've tried different kinds of price analysis in order to make profit, but haven't managed to find one that would bring consistent profitability. That's the main reason behind my decision to try point and figure. It's an old way (more than 120 years?) and traders still use it – so it should be all right?
Anyway I was surprised when you posted non p&f chart. Is it because you find it difficult to maintain profitability with using only p&f charts?

I hope you don't mind the question – it's only me trying to see if it's worth getting involved in it (if it can help with consistent profit making, or is it just another time wasting way good for analysts/software providers and book writers only)
 
can you see the trends if you join up the dots on a lineclose /linedot chart on netdania..any instrument ???
practice a little until you can place trends on effectively
then you can move on to any method of charting data.ie candles,bar,p/f etc etc
remember..linedot charts can be made wider or narrower...with p/f,it is a fixed height and width on the graph paper display
just join the dots..that will be the trend..if the trend is flat..it is a consolidation
nowt else needed
 
. . . Anyway I was surprised when you posted non p&f chart. Is it because you find it difficult to maintain profitability with using only p&f charts?. . .
Hi metrader,
All charts are merely a graphic representation of past price action. One type of chart isn't inherently better or worse than any other. By 'better', I mean more profitable. That's because no chart tells the trader looking at it when to buy or sell. Different chart types enable the trader to view the market in different ways, much like different camera lenses enable photographers to capture different images of the world. A photographer may like and use one lens more than another but, for the most part, the quality of their pictures is down to their ability to compose their shots, get the aperture and timing right and how they use light etc. Whether or not you manage to make consistent profits will, primarily, boil down to how you use charts, be they P&F, Renko, Ichimoku or whatever, rather than anything to do with the charts themselves.
Tim.
 
can you see the trends if you join up the dots on a lineclose /linedot chart on netdania..any instrument ???
practice a little until you can place trends on effectively
then you can move on to any method of charting data.ie candles,bar,p/f etc etc
remember..linedot charts can be made wider or narrower...with p/f,it is a fixed height and width on the graph paper display
just join the dots..that will be the trend..if the trend is flat..it is a consolidation
nowt else needed

Thanks Dentist.
I'll try line and dots. I'm always ready to try new things (already tried quite a few of them without great success so far)


Hi metrader,
All charts are merely a graphic representation of past price action. One type of chart isn't inherently better or worse than any other. By 'better', I mean more profitable. That's because no chart tells the trader looking at it when to buy or sell. Different chart types enable the trader to view the market in different ways, much like different camera lenses enable photographers to capture different images of the world. A photographer may like and use one lens more than another but, for the most part, the quality of their pictures is down to their ability to compose their shots, get the aperture and timing right and how they use light etc. Whether or not you manage to make consistent profits will, primarily, boil down to how you use charts, be they P&F, Renko, Ichimoku or whatever, rather than anything to do with the charts themselves.
Tim.

Thanks Tim.
I'll keep experimenting with p&f – it is one of few ways I haven't tried in my trading. I'm reading a comprehensive book about it atm. There are some good observations and ideas that seem to be so easy to implement in an ideal world and maybe not so when real charts are used.

BTW I've never tried renko – only heard about it being similar to p&f?
 
ok...now we have loaded netdania/netstation
have put up a chart wti crude...crude oil to all
it is a 6 hour linedot....
no lines on it
just looking at the chart...we have the latest trend in full...an uptrend with a consolidat
2zp5yk6.gif
 
note that we broke the range at the end and pulled back into the range...so now we have a new potential upmove forming
 
spx outlook for next week and nfp on friday
labour day tomorrow..all america is closed even if there is a war
looks a little bearish
trend test at 1600/green
res test at 1670 area/purple

141qfx5.gif
 
This short is based on high pole set up (my interpretation of it) – early signal at the 50% retracement. Stop is 3 boxes away – if the column of Os turns into a column of Xs that would cancel the high pole?

Or is this high pole already confirmed by price going below the break out level – so in that case I should have waited for a column of Xs and then for a double bottom signal to enter short? I've read though the author's explanation of this set up again and failed to get a clear idea as how to trade it.

Please feel free to comment.

BTW They expect Mr Bernanke to reduce monthly bond purchases from $85 to $75 billion this month. That could be only first small step ($10 billion reduction) and may help s&p (further possible QE reductions) drop to bullish support line 1 (see the chart)
 

Attachments

  • s&p daily cl 10x3.PNG
    s&p daily cl 10x3.PNG
    46.8 KB · Views: 163
Last edited:
Hi metrader -
here is my humble view.
1. i personally prefer to use log percentages rather than fixed box sizes such as the 10pts that you used for the S&P index, however that is a personal decision and I guess if it works for you than tahts great

2. my strategy would be that if you are comfortable using 10pts for the S&P, draw it again but this time with 5pts (to give you a really short term view). You will see that in the short term chart (using 5pts) there is a clear double bottom sell. So you could therefore short the S&P until the 5pts chart tell you other wise when used in conjunction with your regular 10pts chart. Use both views to examine where the index is going.

Thanks for the comments adeelk.
I'm just learning abut p&f atm, so I need some more time to find out what works and what doesn't.
Percentages may be more suitable for instruments with massive price moves or when using long time horizons (mind you I'm new to p&f and may be wrong).

I've followed your advise and examined 5x3 chart (attached). Somehow the columns are too big – a bit awkward to analyse. Nevertheless there was one signal I liked (supposed low pole compatible with trend)

These are my observations from 5x3 chart:

-there is a double bottom, but it's against the trend and I wouldn't have taken it on it's own. Mind you the entry point coincided with that high pole set up early entry on 10x3 which I've already traded (that trade of mine is against the trend, but high/low poles are mainly counter trend if I'm not mistaken)

-there were two 'just about to happen' early high pole set ups that were never triggered (price missed triggers by only one box in each case)

-there was one low pole set up (is it correct to define it as a low pole?) that worked nicely (that supposed pole was with the trend btw). There was even a hint before it happened – price bounced off that internal uptrend line 5

Feel free to critique & post charts and your favourite set ups.
 

Attachments

  • s&p daily cl 5x3.PNG
    s&p daily cl 5x3.PNG
    27.4 KB · Views: 173
  • poles and non poles on 5x3.PNG
    poles and non poles on 5x3.PNG
    39.1 KB · Views: 220
Last edited:
-there is a double bottom, but it's against the trend and I wouldn't have taken it on it's own. Mind you the entry point coincided with that high pole set up early entry on 10x3 which I've already traded (that trade of mine is against the trend, but high/low poles are mainly counter trend if I'm not mistaken)


Feel free to critique & post charts and your favourite set ups.

It seems as if p&f is not very popular - not many comments so far.

Anyway my trade failed - early high pole set up on 10x3 that coincided with double bottom signal on 5x3 chart. At least stop was not that big - only 3 boxes.

Maybe p&f is good with trending signals only, but then again all other techniques are good for that kind of signals - only thing you don't have to wait for all that boxes before exiting a losing trade.

Whatever the case, I'll try it some more and see if I can reach that aha moment (I've almost read through all the book and still not there as yet)

PS The author appears a bit selective when doing that hindsight analysis especially on 1 box reversal examples (or is it me failing to understand it properly?)
 
the secret is
to move around box sizes and reversals to extract information as you go
 
It seems as if p&f is not very popular - not many comments so far.

Anyway my trade failed - early high pole set up on 10x3 that coincided with double bottom signal on 5x3 chart. At least stop was not that big - only 3 boxes.

Maybe p&f is good with trending signals only, but then again all other techniques are good for that kind of signals - only thing you don't have to wait for all that boxes before exiting a losing trade.

Whatever the case, I'll try it some more and see if I can reach that aha moment (I've almost read through all the book and still not there as yet)

PS The author appears a bit selective when doing that hindsight analysis especially on 1 box reversal examples (or is it me failing to understand it properly?)

out of interest, what timeframe are you looking at when choosing a 5 box setting? It can make quite a lot of difference.

Personally, I never trade off poles. Typically if I see a pole forming I will switch to a high low chart in case of exit, not waiting for it to go past the 50% mark. But I only exit on potential poles forming. I never use it as a form of entry.
Its just a personal preference. If you act on a pole, you are going against the trend and has a higher tendency to fail. I always take signals such as double/triple tops as trend continuation, never against. Just my rule of course
 
out of interest, what timeframe are you looking at when choosing a 5 box setting? It can make quite a lot of difference.

That was daily close - as I understood the author prefers that one to high/low on 3 boxes reversal (daily).
 
That was daily close - as I understood the author prefers that one to high/low on 3 boxes reversal (daily).

I definitely prefer close to high low. But for a daily close chart, a box setting of 5 is far too small in my opinion for the S&P
 
as we have said before
3 box is too clumsy for trading

That's a shame – I liked unambiguous signals generated by 3 box reversal.

1 box reversal at this stage of my p&f development has too many ambiguous signals to my liking. Semi catapults are almost acceptable. Fulcrums (especially complex patterns) are good only with a benefit of hindsight.

Maybe I need to look through that 1 box analysis part again to see if I can decipher any hidden meaning.

I definitely prefer close to high low. But for a daily close chart, a box setting of 5 is far too small in my opinion for the S&P

I guess it depends on the instrument – maybe if there were some big moves, close wouldn't show them?

BTW thanks for all these observations Malaguti – it's always good to hear from somebody who uses p&f to trade. I'm more interested in practical stuff (making profit) rather than excessive analysis.
 
That's a shame – I liked unambiguous signals generated by 3 box reversal.

1 box reversal at this stage of my p&f development has too many ambiguous signals to my liking. Semi catapults are almost acceptable. Fulcrums (especially complex patterns) are good only with a benefit of hindsight.

Maybe I need to look through that 1 box analysis part again to see if I can decipher any hidden meaning.


I guess it depends on the instrument – maybe if there were some big moves, close wouldn't show them?

BTW thanks for all these observations Malaguti – it's always good to hear from somebody who uses p&f to trade. I'm more interested in practical stuff (making profit) rather than excessive analysis.

I'm with you on 3 box. i love them, but my timeframe is different to Dentist's for sure. And even after quite some time, I still dont have the hang of 1 box!!

And yes of course the box size is totally dependent on the instrument. No one size fits all, my statement was really just specific to S&P. 5box on S&P I would be looking at intraday, too noisy on daily
 
Top