Dentalfloss
Legendary member
- Messages
- 63,404
- Likes
- 3,726
it just keeps dumpin
great stuff
great stuff


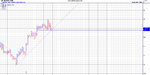
bt group
price is coiled/tight range
gonna pump upwards ??
or test the 272 area/trendline cluster.nicer if we test 272 cluster first...see if the bulls still want to party
a nice /wide horizintal count there
lets see what happens
daily data for the last 6 months
they cut our phone line off 4 times in 1 month...crazy stuff


malaguti
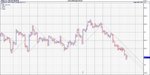
evraz..great stuff
that downtrend has now got intense
see the red and then the change to blue
these cannot be maintained for long..imho

Evraz.......sheesh.....that stock just keeps dumpin
i never realised it was an Abromovitch company
get the bubbly out !!
you have earnt it