Dentalfloss
Legendary member
- Messages
- 63,404
- Likes
- 3,726
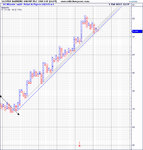
crude oil
wti /continuos contract
60 min data
25 cents box size by 2 reversal
a very smooth uptrend from mid december

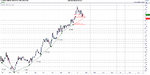
wti /continuos contract
60 min data
25 cents box size by 2 reversal
a very smooth uptrend from mid december