Dentalfloss
Legendary member
- Messages
- 63,404
- Likes
- 3,726
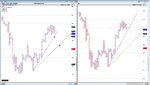
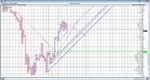
test the dollar strength at that trendline cluster
1.0430 area
4 hour data

1.0430 area
4 hour data


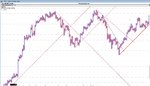
Dentist, how would you read a chart like this?
The most recent has a bullish support line, whereas a longer term bearish line seems to be the most prevalent. Do you wait for the last support line to be taken out or would you trade the forthcoming double bottom?