N Rothschild
Legendary member
- Messages
- 5,296
- Likes
- 603
are you actually ****ing retarded?
are you actually ****ing retarded?
why would i want to build a mechanical system when i have spent about 40 pages slagging you off for them?
im done replying to you, i think i and many others have proved your a complete spastic and any newbies reading this thread will realise that aswell.
why would i want to build a mechanical system when i have spent about 40 pages slagging you off for them?
im done replying to you, i think i and many others have proved your a complete spastic and any newbies reading this thread will realise that aswell.
enjoy your $1500 a year, dont spend it all at once!
Wait, don't exit this thread yet. Let me stoke the fire some...
NR, did you hear what ODT says about your discretionary trading??
ODT, you gonna take that cr*p from NR??
OK...when you hear the bell come out swinging.
DING, DING...
Peter
Well, just read this thread from the start and wanted to point a few things out. ODT was trying to show/teach people some of his systems (all of which are apparently posted to be unprofitable - don't really see the point in that).
However along the way he has shown a lot of contradicting posts. Personally I think this is just the mods messing around .
Right, apparently investment bankers are using systems like this on MT4. This should have been a warning sign right at the start he was a BSer
Oh right, so investment bankers use unprofitable trading strategies to make their money! I don't really see the point in posting unprofitable systems, no knowledge to be gained apart from what to avoid!
Sorry??? Which one is it. Will the system become a self fulfilling prophecy or will it be a fight of latency?
Oh right, so what's that? 1 1/2 years without sleeping? Hang on, you spent $200,000?
Wait a minute there chap, you spent $200,000 - why not trade that $100 per point you were on about?
Glad we cleared that one up, so they won't become a self fulfilled prophecy they'll just fail hugely if he was to post them.
Wait, you spent $200,000 on systems, and could be trading $100 a point - but infact you only have $10,000? What's the point in spending 95% of your capital on system creation?!
Oh right, so that's why you have over 50 systems. To send out emails to C2 and Zulutrade. Now I understand why you have that vendor badge and didn't tell us why.
What about that $100 ODT? Thought you were making millions!
Wait a minute, I thought you said the bigger the size the more the system fails?
Again, why? It'd be more worthwhile to point someone to a pdf in MQL than posting a non-profitable system.
I thought you said previously that only amateurs don't include slippage?
This is easily overcome.
You can't be serious?
-------------------
Just a few from the start of this thread, some other threads and the posts created today are crackers. Especially the comment about being more sophiscated IB's. Also the post about each EA costing $500 to make - (200000/500 = 400 EA's to send out false signals 🙂).
Anyways, ODT I hope you recover from your massive 95% drawdown from trading capital due to investing in system creation. Also, good luck on getting past your pocket money phase. I hope you and your "team" bring some more entertainment to trade2win.
Phil.
There are many ratios used to judge a good automated system
CAGR
http://www.investopedia.com/terms/c/cagr.asp
Sortino ratio
http://en.wikipedia.org/wiki/Sortino_ratio
Sharpe ratio
http://en.wikipedia.org/wiki/Sharpe_ratio
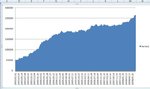
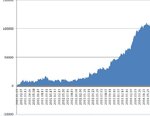
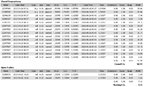
The system has been updated and shows the following over 5.5 years of back tests 2003 to mid 2008, after deducting 1 pip slippage.
Pips profit 214477
investment 50, 000
drawdown 10,000 /20 %
29867 trades
average 7.22 pips per trade profit after slippage 1 pip.
Cagr 77 %
cagr drawdown 3.85
Hmm something to do with the decimal places changing, rite? Whichever, it's not statistically rigorous or robust. My guess is there would be a sharp fall off in performance during the Lehman mess.
I explained the data situation, unavailability of data after mid 2009 and changes to 5 decimal.If you are on a live account , you don't need back testing .Anyway remainder of 2008 was good as I was partly on live and witnessed the performance, 2009 I was on live account and witnessed the market conditions and performance.
I stopped trading nfp days with triple directions of price , which were the biggest losers of money, so actual can only look better
Unavailability of data after 2009? Changes to 5 decimal? What ARE you talking about?
Find a way to get round it, otherwise it negates all your results. Besides which, five years data isn't enough anyway, you should make it 10.
Hmm, so in a couple of years time you will still be showing charts which end in May 2008? Won't that seem a little odd?
Get a different data provider, or re-code to allow for the change in decimal places (why this makes any difference I have no idea, but whatever..).
OR stop referring to out-of-date, redundant charts.
YES the most recent data DOES matter, OF COURSE it does. In fact, it's MORE relevant than what happened 8-9 years ago.
If you're using only one set of data points which stopped 2 years ago, how can you possibly have confidence in the results you're getting??
There is so much wrong with your response, I don't know where to start.
1. "Live trading is superior to backtesting" Ok, why have you bothered to show any graphs if you think it's not really that important? You contradict yourself. (By the way, do you even know what "forward testing" means?)
2. "Only a few months of backtesting is required" Utter garbage. If your system worked well during the first 3 months of 2007 when vols were at an all time low, would you expect it to perform in the same manner during the last 3 months of 2008, when vols were extremely high?
3. "The problem arises with cluless amateurs designing mechanical systems" -- buddy, you're talking about yourself.
I truly hope that no-one takes anything you say seriously.