Key To Markets - Discussions

Weekly Preview (Dec18-22). CAD and JPY crosses are in focus

As we enter to last two weeks of 2017, the US dollar traders focus on the tax reform vote. Besides, our focus over the week ahead will be on RBA minutes, NZ GDP, BOJ policy meeting, Canada data releases and US GDP.

From RTRS: “Top U.S. Republicans said on Sunday they expected Congress to pass a tax code overhaul this week, with a Senate vote as early as Tuesday and President Donald Trump aiming to sign the bill by week’s end. John Cornyn, the No. 2 U.S. Senate Republican, said in an interview on ABC’s “This Week” that he was “confident” the Senate would pass the legislation, “probably on Tuesday.” Republican Representative Kevin Brady said he believed his party had the votes to pass the bill.” Reported by GS Research.

RBA Minutes of December 2017 Monetary Policy Meeting of the Reserve Bank Board 19 December 2017, 11.30 am AEDT.
The RBA minutes is unlikely to provide any clue of the policy shift.

NZ Q3 GDP
In Q2 2017, New Zealand economy grows 0.8 percent. Growth for the year ended June 2017 was 2.7 percent, compared with 2.9 percent growth for the year ended March 2017.

We believe in Q3 the economy likely to grow lower than Q2, i.e 0.6%.

BOJ policy meeting
We believe the Bank of Japan likely to leave its policy unchanged at this week’s meeting (Dec 20-21).

From GS Research: “We do not expect any changes at the upcoming December 20-21 BOJ meeting. Specifically, we think it will maintain its targets for the short-term rate (-0.1%) and 10-year interest rate (around 0%), and make no changes to its purchasing program for ETFs and other risk assets.”

CAD risk events
This week we have Canada CPI, retail sales and GDP.

US GDP
In Q2 2017, US GDP increased at an annual rate of 3.1 percent. We expect in Q3 the growth forecast unrevised at 3.3%.

cap.png

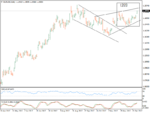
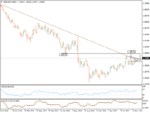
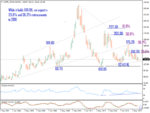
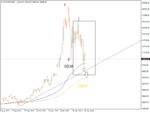
Chart of the day in European session:

EURGBPH4-1.png

For FX weekly trading perspective we focus on AUD ,JPY,CAD crosses and USDJPY. Please watch this space again for trading views.

It is important to always keep in mind the risks involved in trading with leveraged instruments.

Have a question? Let us help!

A KTM Analyst is ready to assist you, click on the comment section below​
 
BRENT: $61 is the key for bears

Oil traders remain their focus on the developments in North Sea pipeline outage. Oil market forecasters OPEC, EIA and IEA offer differing oil outlooks for 2018.

Hedge funds and other money managers pared their net long U.S. crude futures and options positions in the week to Dec. 12, cutting the holdings for a second week after hitting a record high, the U.S. Commodity Futures Trading Commission (CFTC) said on Friday, reported by Reuters.

The oil rig count fell by four to 747 in the week to Dec. 15, Baker Hughes said in its closely followed report on Friday.

“We see that 2018 might not be quite so happy for OPEC producers … 2018 may not necessarily be a happy new year for those who would like to see a tighter market. Total supply growth could exceed demand growth,” the IEA said Thursday.

brent-2.png

Image source: Platts.com

The holiday season suggests the oil price likely to remain in a rectangular pattern. Last Tuesday the price failed at the break level fell back to the lower end of the pattern. As we are heading to the year-end, we believe the price action likely to cap between 64.50-68.30.

Fib extensions: Daily 100.0fe seems at $67.30 and weekly 161.8fe seems at $68.30.

Support: 63.50, 62.80 and 62.00. Additional support finds at 61.00 a parallel daily support.

Resistance: 63.50, 64.25 and 65.50

BRENTH4-3.png

View: A move below $61 could open to 57$ initially.

It is important to always keep in mind the risks involved in trading with leveraged instruments.

Have a question? Let us help!

A KTM Analyst is ready to assist you, click on the comment section below
 
NZDUSD: Buy the dip. Held support trendline

Data review:

New Zealand headline business confidence showed a net 38% vs 39% in November. Businesses are pessimistic about the year ahead, an ANZ Bank survey showed on Dec 19 Tuesday. Headline business confidence remains negative across all the five sub-sectors, ANZ research note reported.
New Zealand’s seasonally adjusted current account deficit for the September 2017 quarter narrowed to $1.3 billion, Stats NZ said today.

Data preview:

GDP (Thu)
NZ economy was up 0.8 percent in the June 2017 quarter. In Q3 we expect the economy will grow 0.6%. A bullish NZD reaction could expect if the GDP grows above 0.7%.

FX overview:

The kiwi bird before retraced to 0.6965 it was rejected at 100DEMA multiple times coincides with a 38.2 % fib reaction (0.7435-0.6780 fall). Recent price action manages to hold the earlier breakout level.

NZDUSDDaily.png

Support 0.6960, 0.6900 and 0.6815

Resistance 0.7035/0.7055, 0.7100 and 0.7200

Bottom range: 0.6815-0.6780

As we enter to last phase of 2017, we believe the cross likely to face potential resistance at 0.7070 it’s 20WMA. The daily RSI crawls nearly overbought and the oscillator turned bearish. AT higher time frames (weekly) the oscillator turns bullish. Buying the dip is our theme.

NZDUSDWeekly-1.png

Readers can remind we initiated our first buying trades (after election hangover) at 0.6845 minutes before NZ jobs data in October.

Trade: We remain a buyer into 2018 for 0.7100/0.7130 and 0.7200.

It is important to always keep in mind the risks involved in trading with leveraged instruments.

What is your Technical View?

Do you have a different idea? Please leave us a comment and get an answer from our professional analysts.​
 
GBPAUD: Trading at a big support in a falling channel.

The price fell below the ascending trendline and re-tested the 50.0 fib reaction (1.6684-1.7995 rally) coincides with 50DMA finds at 1.7340. A move below this could open to retrace further towards earlier breakout trendline (below chart).

GBPAUDWeekly.png

Medium term: S1: 1.7340, S2: 1.7200-1.7180

Intraday support finds at 1.7340 and 1.7290 it's 38.2 fib reaction (Aug-Dec rally)

Resistance 1.7400, 1.7440 and 1.7510

The daily RSI propelling down and oscillator remain bearish. The selling pressure remains until trades below 1.7510. A move below 1.7290 needed to forecast 1.7200-1.7180 levels.

GBPAUDH4.png

It is important to always keep in mind the risks involved in trading with leveraged instruments.

Have a question? Let us help!

A KTM Analyst is ready to assist you, click on the comment section below​
 
USDZAR: Retraced to support zone but extremely oversold

The cross was closed below 2017March 27 low. It has an immediate support finds at 12.15 its 100EMA below this 11.50 exists, it’s 200EMA on the monthly chart. Additional support finds at 12.00 a psychological support.

The daily RSI is extremely oversold to 21. By considering this we believe the cross likely to hold the support zone 12.20-12.00. In this case, a minor rebound towards 12.50 and 12.80 could be expected initially in Jan/Feb 2018. We are also focusing on the descending trendline (below chart)

USDZARDaily.png

View: Buying between 12.20-11.80 sl 11.50 targets are 12.50 and 12.80.

It is important to always keep in mind the risks involved in trading with leveraged instruments.

Have a question? Let us help!

A KTM Analyst is ready to assist you, click on the comment section below
 
2018 fx technical outlook

In this year-end article, we are providing couple of bullish trades
  • AUDUSD: We forecast bullish target of 0.7980/0.8000
  • EURUSD: We forecast bullish targets of 1.2300 and 1.2500
  • GBPUSD: Might rally further to 1.3800 and 1.4000
  • NZDUSD: Buy the dip favors
  • USDJPY: We are waiting for a dip to buy near 110.00 levels
  • USDZAR: Minor rebound towards 12.50 and 12.80 could be expected

Please download the full report from our Key To Markets Blog

It is important to always keep in mind the risks involved in trading with leveraged instruments.

Have a question? Let us help!

A KTM Analyst is ready to assist you, click on the comment section below​
 

Attachments

  • EURUSDDaily.png
    EURUSDDaily.png
    23.9 KB · Views: 247
  • GBPUSDWeekly.png
    GBPUSDWeekly.png
    24.3 KB · Views: 207
  • COFF_ARABMonthly.png
    COFF_ARABMonthly.png
    36.2 KB · Views: 233
EURUSD: Extra mile

The common currency outperformed on the first trading day of the year, closed with solid gains 0.40%. In 2017 EURUSD rose as much as 16+%, printed the biggest annual gain since 2003.

Data review: PMI surveys will dominate the economic data calendar week
  • Spain manufacturing PMI posted 55.8 in December, down slightly from the near 11-year high of 56.1 in November
  • Italy Manufacturing PMI recorded 57.4 for December vs 58.4 in November
  • France manufacturing PMI posted 58.8 in December up from 57.7 in November
  • Germany Manufacturing PMI climbed to an all-time high of 63.3 in December from 62.5 in November
  • Final EZ Manufacturing PMI at 60.6 in December, its best level since the survey began in mid-1997 according to IHS Markit

Data preview:
Week-ahead.png

TECHNICAL VIEW​
2018 outlook: We believe in 2018/2019 the ECB policy likely to dominate the Fed. Support finds at 1.1550.

View: In 2018, we forecast bullish targets of 1.2300 and 1.2500.

Weekly range: 1.2120-1.1940

While holding the 1.1550 early Nov, 2017 low buying the dip favors the trend. The daily RSI is nearly overbought buy the oscillator remain bullish. Buying the dip favors the near-term trend.

FX traders are waiting for the first US NFP data (Fri). While you were away, we published 2018 FX and Agri commodities bullish trades available to download in our KTM blog.

It is important to always keep in mind the risks involved in trading with leveraged instruments.

Have a question? Let us help!

A KTM Analyst is ready to assist you, click on the comment section below​
 
USD crosses technical overview

The dollar index rebounded on Wednesday, FX participants focus on the first US NFP data (Fri). In the last month of 2017 jobs report, we expect the economy likely to add 200k new jobs.

  • The average earnings ratio will remain at 2.5% on a yoy basis
  • The jobless are forecast to remain unchanged at 4.1%
FX TECHNICAL OVERVIEW

USDX: The dollar index retraced more than 80.0 of the recent rally (90.97-95.00). Yesterday’s low has coincided with 100.0fe (95.0-92.40-94.18) find at 91.40 below this 90.97. The daily RSI stands at 33, yesterday’s low was 25. The rebound program will be activated for 92.60 and 93.00 ahead of jobs data.

USDCAD: High volatility expected on Friday as US and Canada jobs data will hit the wires. Support finds at 1.2500 it’s 50.0 fib (1.2060-1.2916) and 1.2410/1.2400. Additional support is found at 1.2385 it’s 61.8 fib reaction. Resistance seems at 1.2620 and 1.2660. A move below 1.2500 needed to forecast 1.2460 and 1.2420/1.2400. We are a buyer in a dip between 1.2420-1.2380.

USDCNH: Parallel support in focus. Near-term finds at 6.4800 and medium term finds at 6.395<6.40. The RSI likely to print a higher low pattern on the daily and weekly aswell. A move below the parallel support (2016 March-2017 Sep) might print a positive divergence. Bullish reaction expected.

USDCNHDaily.png

USDJPY: Spotted with a double bottom at 112.00. Near-term support zone remains between 112.00-111.90. Resistance seems at 113.00, 113.40 and 113.75. The ABC pattern aiming at 110.00. As we analyzed in our 2018 FX outlook report, we remain a buyer at 110.00.

USDSEK: Held the 61.8% fib reaction (Sep 08-Nov 21) and 50MA (weekly @8. 1285<8.0920<8.0300 its 80.0 fib and a parallel support. The RSI is nearly oversold. The cross is offering limited downside risk in the near term.8.2630 and 8.3000 possible while holding the support base 8.0925-8.299

USDSEKWeekly.png

USDZAR: The cross likely to hold the support zone 12.20-12.00. In this case, a minor rebound towards 12.50 and 12.80 could be expected initially in Jan/Feb 2018. We are also focusing on the descending trendline (below chart) View: Buying between 12.20-11.80 sl 11.50 targets are 12.50 and 12.80

It is important to always keep in mind the risks involved in trading with leveraged instruments.

Have a question? Let us help!

A KTM Analyst is ready to assist you, click on the comment section below​
 
AUDUSD and NZDUSD: Take profit action required (P&L +3.4 and 3.5%)

AUDUSD has been running North for thirteen straight sessions. From December 2017 low, the run extends for eighteen sessions except for one day. Finally, the cross has entered the overbought zone.

What’s on today?

Asia: November Trade balance
US: NFP data

FX overview​
Stiff resistance from 50.0 reaction seems at 0.7885 coincides with 50WMA above this 0.7900 exists (Oct 13 high). The RSI stands at 77. A move above 0.7900 could open to 0.7940. We believe in the near term, the cross offers limited upside risk.

Support finds at 0.7830 and 0.7785.

Readers can remind we have advised a buying trade for 0.7900 recorded at 0.7640 ( P&L 3.4% )

AUDUSDDaily.png

View: Take profit action required

NZDUSD reached a high of 0.7160 rebounds nearly 50.0 of the fib reaction (0.7560-0.6780 fall). Finally, the cross has entered the overbought zone.

Event risk:

We will focus on today’s US NFP.

FX OVERVIEW​
Stiff resistance from 50.0 reaction seems at 0.7170. The RSI stands at 73. We believe in the near term; the cross offers limited upside risk. Ahead of today’s NFP data the cross has a resistance zone seems between 0.7170-0.7200.

Support finds at 0.7170 and 0.7070

Readers can remind we advised a buying trade for 0.7100/0.7130 and 0.7200 recorded in 0.6845 again given at 0.6980 ( P&L 3.5% )

NZDUSDDaily.png

View: Take profit action required

It is important to always keep in mind the risks involved in trading with leveraged instruments.
Have a question? Let us help!

A KTM Analyst is ready to assist you, click on the comment section below​
 
Global economic calendar. US CPI and ECB minutes are in key focus.

The brand new week Kicks off with Bank of Canada’s Business Own Survey (BOS) due Monday. Post-Friday’s Canada December jobs report, chances of a hike on Jan. 17 rose to more than 60% from 35%.

This week we are focusing on CAD and AUD crosses, especially AUDCAD. We have lots of China data due this week. USDCNH and AUDUSD are in focus. Last week’s China General Services PMI reading rose to 53.9 in December, the highest level since August 2014. “The Chinese economy finished last year on a strong note, marking its best year since 2010”, according to the Caixin China PMI surveys.

The USD will grab the attention on the last trading day of the week, CPI and Retail sales are due (Fri). Volatility remains on USDCAD again and USDJPY. December Nonfarm payrolls came in a bit softer than expected, 148k vs 200k forecast.
The US inflation will provide a clue to forecast the chances to revise the Fed’s 2018 rate hike projections, currently stands at three. According to CME FedWatch tool, markets are expecting March rate hike with a probability of 67%.

In the EA, given the lack of macroeconomic data (high impact), it is understandably a quiet week in the markets. FX participants focus on ECB meeting minutes (Thu). Chris Williamson, Chief Business Economist at IHS Markit said: A stellar end to 2017 for the eurozone rounded off the best year for over a decade.

In the UK, Manufacturing Production data due Wednesday.

WEEK-1.png

Chart for the week:

View: Neutral


USDCADDaily.png

It is important to always keep in mind the risks involved in trading with leveraged instruments.
Have a question? Let us help!

A KTM Analyst is ready to assist you, click on the comment section below​
 
EURUSD: European outlook continued to support the bulls

As 2018 unfolds the euro lovers rushed to buy the common currency, but failed to elevate above Sep 2017 high. In 2017, the euro rallied 16%, led by the EZ economic growth story. We believe the story likely to continue this year as well, in addition to that euro not yet fully priced for ECB. We also believe in 2018 the ECB policy likely to dominate the Fed.

Chris Williamson, Chief Business Economist at IHS Markit said: A stellar end to 2017 for the Eurozone rounded off the best year for over a decade.

Data review:

Spain manufacturing PMI posted 55.8 in December, down slightly from the near 11-year high of 56.1 in November
Spain Services PMI ticked up to 54.6 in December from 54.4 in November
Italy Manufacturing PMI recorded 57.4 for December vs 58.4 in November
Italy Services PMI improved to a level of 55.4 in December from November’s 54.7
France manufacturing PMI posted 58.8 in December up from 57.7 in November
France Services PMI posted 59.1 in December down from November’s six-and-a-half year high of 60.4
Germany Manufacturing PMI climbed to an all-time high of 63.3 in December from 62.5 in November
Germany Services PMI climbed to 55.8 in December from 54.3 in November
Final EZ Manufacturing PMI at 60.6 in December, its best level since the survey began in mid-1997 according to IHS Markit
Eurozone economic growth highest since early-2011, 56.6 in December, up from 56.2 in November

Data Preview: Given the lack of macroeconomic data (high impact), it is understandably a quiet week in the markets. FX participants focus on ECB meeting minutes (Thu).

FX OVERVIEW​
The EURUSD bullish theme will continue in 2018 based on the EZ economic growth story and room to price for ECB.

In the near-term perspective, EURUSD so far held the stiff resistance (September high )1.2090. The daily RSI propelling down and the oscillator turned bearish.

Weekly trading range 1.2120-1.1800


A bullish break through September high needed to upgrade the over short term, remote changes at the current stage. The focus shifted back to supports available at 1.1900/1.1880 and 1.1820/1.1800. Alternatively, a weekly close above 1.2130 could open to 1.2300 and 1.2400 (KTM 2018 targets)

View: Buying between 1.1850 and 1.1800 sl below 1.1700 targets 1.2000 and 1.2100 initially.

EURUSDDaily-1.png

It is important to always keep in mind the risks involved in trading with leveraged instruments.

Have a question? Let us help!

A KTM Analyst is ready to assist you, click on the comment section below​
 
JPY crosses technical overview and trade setups

The Yen jumped range between 0.40%-1.10% on Tuesday session as Bank of Japan trims bond buying.

News: The Bank of Japan on Tuesday reduced the amount of its buying in Japanese government bonds with 10 to 25 years left to maturity and those with 25 to 40 years to maturity by 10 billion yen ($88.39 million) each from its previous operations, said Reuters.

FX OVERVIEW
AUDJPY: rejected at a parallel resistance at 89.00 and spotted with a double top. Immediate support finds at 89.60 below this steep fall could open to 87.50 and 87.25.
Near-term potential resistance zone remains between 89.00 and 89.40 above this 90.00 and 90.30 could possible.

AUDJPYDaily.png

At higher time frames, stiff resistance seems between 90.30 and 91.30. A break above 91.30 needed to forecast 97.00.

AUDJPYMonthly.png

CADJPY: The price action has failed in September 2017 high. Potential support zone finds between 89.30-88.80. We believe further retracement possible.

CHFJPY: Stiff resistance seems between 61.8 and 78.6 fib reactions. Selling between favors the trend aiming to support base initially 112.85.
A breach below could open to a bigger retracement to 112.00/111.80 it’s 100MA (weekly), 110.0 it’s 100.0fe and 108.00 April 2018 low.

CHFJPYDaily.png

EURJPY: The price action re-tested the earlier breakout level finds between 133.90-134.50 below this 133.00 exists. Potential short-term support base finds between 131.65-131.15.

GBPJPY: The cross again failed at 200WEMA. Support finds at 151.70 and 151.20. A move below 151.00 needed to forecast 150.60,150.00 and 149.40.
Potential support base finds at 147.00 while holding the uptrend continues.

GBPJPYDaily.png

USDJPY: The recent price action remains between 112.00 and 113.50. The correction phase continues in the short term. A move below 111.90 could open to further retracement to 111.70/111.50. Deep additional support finds at 110.00.
A break above 113.45-113.75 resistance zone should help to confirm the bullish bias.

NZDJPY: The cross has been moving higher for seven straight weeks, finally snap the rally. Potential resistance seems at 81.40 and 81.70-81.90. We believe NZD is overly stretched, correction is imminent to 80.00 and 79.60 in the near term. Over short-term selling on every rise favor the trend. To limit the risk use sl above 84.00 targets at 79.50 and 78.00.

NZDJPYWeekly.png

It is important to always keep in mind the risks involved in trading with leveraged instruments.

Have a question? Let us help!

A KTM Analyst is ready to assist you, click on the comment section below​
 
Last edited:
AUDUSD spikes after November retail sales beats forecast

The Aussie dollar rose 0.30% against the most-traded currencies after the November Retail sales data hit the wires.

Australian retail turnover rose 1.2% in November 2017, this follows a 0.5% rise in October 2017 according to the latest Australian Bureau of Statistics (ABS) Retail Trade figures.

AUDUSD spikes after November retail sales beats forecast. The 61.8 fib reaction seems at 0.7890 above this 0.7900 Oct 13 high exists.

A move above 0.7900 needed to strengthen further for 0.7940 and 0.7990.

Weekly trend remains between 0.7950-0.7800

While holding 0.7800/0.7790 bulls try to rally further. Alternatively, 0.7800 and 0.7735 is an open target, if price truncated the 0.7800.

AUDUSDDaily-4.png

It is important to always keep in mind the risks involved in trading with leveraged instruments.

Have a question? Let us help!

A KTM Analyst is ready to assist you, click on the comment section below​
 
EURUSD: Hawkish ECB minutes gave the euro bulls a boost

The euro rallied 0.70% overnight on the back of the ECB minutes. The more hawkish ECB minutes pushed the EURUSD above 1.20 on a daily closing basis.

The minutes to December 13-14 European Central Bank policy meeting showed “recent indicators pointed to a continued robust and increasingly self-sustaining economic expansion”.

The ECB minutes also showed the euro had remained broadly stable and US Commodity Futures Trading Commission numbers suggested that the market remained positioned for an appreciation of the euro.

The euro bullish reaction to the ECB minutes led by the expectations that the ECB is edging toward removal of the stimulus. The 10y Bund and German government debt yields rose after the minutes.

EURUSDH1.png

We believe in 2018/2019 the ECB policy likely to dominate the Fed. We retain bullish targets of 1.2300 and 1.2500.

At higher time frames while holding 1.1550 Nov 2017 low, the EURUSD will rally further ahead (below chart)

In the near term, while holding 1.1900, the uptrend will continue for 1.2120 and 1.2190.

EURUSDWeekly.png

Euro score board:

EURUSD 0.70%, EURCAD, EURGBP and EURJPY 0.50% each, EURUAD marginally up 0.10% and EURNZD down 0.10% (Time 7.30Am AEST).

It is important to always keep in mind the risks involved in trading with leveraged instruments.

Have a question? Let us help!

A KTM Analyst is ready to assist you, click on the comment section below
 
Friday FX preview

The euro popped 0.70% after the hawkish ECB minutes, AUD and NZD rallied further on a weak US dollar. The 10y Bund and German government debt yields rose after the minutes. The US dollar fell against all G10peers.

Natural gas rose more than 6% and Gold closed with marginal gains. Brent oil erased intraday gains and closed with marginal losses.

Bitcoin down nearly 14% to a low of $12569. Today in Asia session Bitcoin again down, nearly 5% to a low of 12684$ (10.40 Am AEST)

Data review:

Australian retail turnover rose 1.2% in November 2017, this follows a 0.5% rise in October 2017 according to the latest Australian Bureau of Statistics (ABS) Retail Trade figures.
Industrial production up by 1.0% in euro area Up by 0.9% in EU
The US Producer Price Index for final demand fell 0.1 percent in December
In the week ending January 6, initial claims was 261,000, an increase of 11,000 from the previous week’s unrevised level of 250,000

What’s on today?

Asia:
Japan’s November quarter current account 1.7005 trillion yen, expected 2168.9 billion yen, the previous value of 2.4515 trillion yen
Asian FX traders are watching China Trade balance
US December CPI and Retail sales

News:

President Donald Trump tells The Wall Street Journal that Mexico could end up paying for his proposed border wall “indirectly” CNBC reported. FX to watch: USDMXN
Dudley said, the Fed is expected to raise interest rates three times in 2018, and such expectations are a reasonable starting point.
FX :

USDJPY extend the overnight losses on Friday early Asia session, moved to 111.00. It has a parallel support finds at 110.80.

Ahead of today’s CPI data, trading range remains between 110.80 and 112.00. The initial target on a breakdown is 110.00/109.80, an ABC equality from 114.73-110.84-113.75.

USDJPYDaily.png

It is important to always keep in mind the risks involved in trading with leveraged instruments.

Have a question? Let us help!

A KTM Analyst is ready to assist you, click on the comment section below​
 
EUR- Phoria continues

The single currency gained as much as 1.50% during the second week of 2018 against the USD. The euro has closed its strongest level against the dollar since 2014.

The EUR was boosted by the breakthrough in Germany’s coalition discussion. The weaker US dollar and the hawkish ECB minutes released earlier this week extends the rally to 50.0% fib reaction (1.3990-1.0340 fall).

As we forecast in last week’s daily FX article, the price action reached our near-term targets, take profit action required.

Intraday support finds at 1.2115 and 1.2020/1.2000.

We believe in 2018/2019 the ECB policy likely to dominate the Fed. We retain bullish targets of 1.2300 and 1.2500.

EURUSDWeekly-3.png

Today in Asia session the EUR down 0.50% against NZD, 0.3% against AUD and JPY. But against the greenback manages to hold 1.22 handle.

It is important to always keep in mind the risks involved in trading with leveraged instruments.

Have a question? Let us help!

A KTM Analyst is ready to assist you, click on the comment section below​
 
EURUSD extended the rally 0.60% on the fourth straight session. The single currency rose as far as 1.2296 nearly completed KTM’s 2018 first target. The euro has closed its strongest level against the dollar since 2014. Post-ECB minutes the ECB rate expectations are re-priced.

ECB’s Governing Council member Hanson said “the euro appreciation will not threaten the inflation outlook”. After the comments were published the euro extended the gains touching 1.2296.

Data review:

Euro area international trade in goods surplus €26.3 bn and €8.0 bn surplus for EU

Data Preview:

We have little economic data this week. Monetary policy expectations and dollar weakness are the key drivers this week. ECB reviews monetary policy next week (Jan 25)

Capture-2.png

FX overview​
We believe in 2018/2019 the ECB policy likely to dominate the Fed. We retain bullish targets of 1.2300 and 1.2500, first target almost completed. We still believe the consistent EURUSD bullish trend will continue further.

At higher time frames while holding 1.1550 Nov 2017 low, the EURUSD will rally further ahead (below chart).

EURUSDWeekly-4.png

Parallel resistance seems at 1.2330 Oct 2008 low above this 1.2360 200EMA (monthly) exists.
Support finds at 1.2240 and 1.2180.
Weekly trading range remains between 1.20 and 1.2400.
We advised to take profit at 1.2200 in our yesterday’s article and repeat the same today aswell.

View: Take profit action required.

It is important to always keep in mind the risks involved in trading with leveraged instruments.

Have a question? Let us help!

A KTM Analyst is ready to assist you, click on the comment section below​
 
BoC neutral hike will cap further CAD gains

CAD expose downside risk against the USD to BOC policy statement and NAFTA uncertainty. We believe Bank of Canada to hike 25bp to 1.25% on Wednesday meeting. In 2018 we are expecting 3 hikes, this week’s hike likely to shape a dovish hike.

On a medium-term basis, NAFTA uncertainty is the headline risk to the CAD, capping further CAD gains. The next round of NAFTA negotiations, sets for Jan23-28th.

Bank of Canada to hike on a neural basis or on a hawkish tone. In case of a neutral hike, CAD gains against the USD will limit to 1.2350. A hawkish hike will drag the USDCAD further to 1.2300 or in an extreme case 1.2200 it’s 80.0% reaction (below chart).

We are a buyer into BoC and a dip buyer ( at 80.0% fib reaction) into next week’s next round of NAFTA negotiations.

A potential close above 1.2600 could open to 1.2660 and 1.2770 in the near term. The latest IMM data suggest that CAD positioning increased slightly ahead of BoC meeting.

In the medium term, 1.29 and 1.2970 are achievable in case of a higher low pattern on the weekly chart. If the pattern evolved as we expected 1.3200 is the final target.

The USDCAD remains flat in Asia trade (1.00 PM AEST) as investors brace for BoC rate hike. Intraday trading range remains between 1.2300 and 1.2600.

USDCADDaily-1.png

It is important to always keep in mind the risks involved in trading with leveraged instruments.

Have a question? Let us help!

A KTM Analyst is ready to assist you, click on the comment section below​
 
KTM daily: CAD insights

Bank of Canada hiked rates by 25bps to 1.25% for a third time to the highest level in the post-recession period. The policy decision was widely expected focus shifts back to NAFTA risk.

The Bank maintained a cautious tone, helped the USDCAD to held the support (Jan 05 low) in line with our expectations.

In the Press Statement Governor Poloz said, domestic economic growth remains clouded by uncertainty related to the future of the North American Free Trade Agreement (NAFTA). Based on the NAFTA risk we believe further scope for CAD depreciation.

BoC's forecast:

The bank highlighted “real GDP growth is expected to slow to 2.2 per cent in 2018 and 1.6 per cent in 2019, following an estimated 3.0 per cent in 2017.

The bank maintained an optimistic view on the 1Q 2018. “Growth is expected to remain above potential through the first quarter of 2018 and then slow to a rate close to potential for the rest of the projection horizon”.

In terms of inflation, the Bank expects CPI inflation to fluctuate in the months ahead. The bank also forecast “inflation is expected to remain close to 2 per cent over the projection horizon”.

The Governor Poloz said the economic outlook is expected to warrant higher interest rates over time. He also said, further rate hikes are guided by “incoming data”.

FX reaction:

The CAD was weakened after the BoC announcement but USDCAD gains were wiped off with a limited change in the BoC’s tone.

Our forecast:

In yesterday’s article, we forecast “In case of a neutral hike, CAD gains against the USD will limit to 1.2350”. The price action held the parallel support finds at 1.2350, on a weekly basis the probability of shaping into a triple bottom is gradually increasing.

In the near term, while holding 1.2350 on a daily closing basis, we again forecast a bullish reaction to the 1.2530 above this 1.2590 also possible.

A trend reversal could have expected if close above 1.2600. In this scenario 1.2660,1.2770 and 1.2830 are an open target.

USDCADDaily-2.png

It is important to always keep in mind the risks involved in trading with leveraged instruments.

Have a question? Let us help!

A KTM Analyst is ready to assist you, click on the comment section below
 
KTM Daily: charts set-up. Bitcoin held 100EMA

USDX: The dollar index has made a low at 89.90 on Jan 17 held the 161.8 Fe support 89.80. The daily ABC pattern (95-92.40-94.20) target of 161.8 finds at 89.80. The USDX is stable at a four-month descending trendline (below chart). Near-term support zone remains between 90.00-88.00. We believe while holding 89.80 minor rebound could expect to 91.00 and 91.50. The daily RSI appears a double bottom and the oscillator turned bullish.

USDXWeekly-1.png

Bitcoin: After a steep fall nearly 20% this week the digital currency Bitcoin managed to hold the 100EMA on a daily closing basis. Past two days and today’s Asia session price action indicating between 11,330$ and 11,430$ is an initial resistance zone. A move above those needed to rebound further to 12570-12740.

Weekly support finds between: 9170-8790 it’s 100MA below this 7970 200EMA exists.

Brent: We spotted a bearish H&S pattern on the H1 chart. Neckline finds at 68.30, breakout still not visible. Shoulder seem between 69.30-69.70. A move below the neckline needed to forecast 67.50.

BRENTH1.png

AUDJPY: The cross is trading on a verge of a neckline break seems at 89.00. A move above this could open to 89.40. Further strength will attach if 84.40 taken out decisively to forecast 90.00 and 90.30. Alternatively fails to cross 89-89.40 will retrace for 88.30/88.00. The daily RSI marks a lower high. Intraday support finds at 88.50 and 88.30/88.00

AUDJPYDaily-1.png

It is important to always keep in mind the risks involved in trading with leveraged instruments.

Have a question? Let us help!

A KTM Analyst is ready to assist you, click on the comment section below​
 

Attachments

  • BTCUSDDaily.png
    BTCUSDDaily.png
    19.9 KB · Views: 186
Top