You are using an out of date browser. It may not display this or other websites correctly.
You should upgrade or use an alternative browser.
You should upgrade or use an alternative browser.
Martinghoul
Senior member
- Messages
- 2,691
- Likes
- 277
You're absolutely right... I apologize, but I just couldn't contain myself. It was really too much when someone like you starts calling himself a risk-taker.Hello Martinghoul,
I stand by what I wrote. I have become a risk-taker only after intensive training with the demo.
But, I kindly want to remind you of your own posting regarding my other thoughts I wrote in my journal:
http://www.trade2win.com/boards/tra...aka-traderum-using-demo-acct.html#post1011466
FYI: this is a journal, not neccessarily a discussion group. If you don't like my writings then simply don't read.
I have the feeling that you are trying to create problems, but I'm not interested in any problems.
I'm sorry to say this, but IMHO you better should try to participate in other forums/threads/journals etc.
Thank you for your cooperation.
Cheers,
traderum
At any rate, as I said before, best of simulated luck to you in your simulated punting.
It went ok, another 8.7k to add to the daily result.Oops.... I couldn't let it be and have opened a new position... 🙂
Again SPY...
In the above case my stake was 120 contracts for 1.72 each (ie. 120*100*1.72 = about $20.6k).
I sold them some hours later for 2.46 each.
Ie. a profit of 43%. With options such P/L in such a short time is very normal due to the leverage effect (regarded the underlying stock makes some moves).
I have also had cases with over 100% ! 🙂
If one is really good in options trading then one can make a killing in the markets.
I think I'm already good with options, but I try to improve my skills to become very good.
But with options one can also lose 100%, and even more if one uses shorting 🙂
But by using a good money and risk management one can prevent this by either taking a loss,
or doing exactly the unexpected: buying more!!! 🙂 I like to do the latter as said in previous postings 🙂
I'm of course not trying to do harakiri, for me it's all simple maths, probability, and contra-psychology,
ie. a strategy, that I apply. One can also say "poker methods", though I even don't know how to play poker or any other such game, except chess.
Another problem with options is that they lose value with time b/c they have an expiration date.
But when daytrading options this is usually a no issue. It's more an issue for long term investors.
Last edited:
It catched my eye that many traders think in absolute terms, be it their stops or be it their P/L etc.
IMO one better should think always in terms of percentages instead of absolute values.
By this, one also implicitly "normalizes" the values and makes also a comparison possible.
And strategies work best with percentages than with absolute values.
IMO one better should think always in terms of percentages instead of absolute values.
By this, one also implicitly "normalizes" the values and makes also a comparison possible.
And strategies work best with percentages than with absolute values.
Last edited:
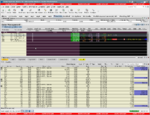
The said SPY holdings of Monday/Tuesday (cf. old postings) have met their targets.
Here are the open orders of then and the current quotes.
It shows that I did not make any loss with them, but I had to wait about 3 to 4 days... it paid off...
Here are the open orders of then and the current quotes.
It shows that I did not make any loss with them, but I had to wait about 3 to 4 days... it paid off...
Attachments
Last edited:
Bot some AIG Puts.
...
Bot some more AIG Puts 🙂 b/c pos was about -15% in the negatives... 🙂
...
Now only -3%... and keeps getting better...
...
Nope, again down to -9%...
...
-2% now...
...
+1% now
...
My stake is about 45k...
...
-3% now
...
-8% now.... 🙂
...
Hmmm. now -18% (!), unbelievable, that thing keeps rising and rising, and I bot Puts... 🙂
Keep cool boy...
Now -15%
I think I should prepare my next strategic buy at -20% or so...
...
have doubled it...
now -11%...
now -7%
...
finally in the positive area: +5.5%
...
-6%
shorted some AIG Calls
cumulated pos now -2.25%
...
hmm... doesn't look good... almost -10%
Ok, now I should simply lean back and wait, no more buying... whole stake is about 115k...
...
+2%
...
-11%... As it looks like I _must_ buy some more... an order is already out... not filled yet...
...
Hey, the MM offers me to close with a profit of +1.45% 🙂)) No thx MM! 🙂
Now he offers me +2.5%... Forget it man!
...
It looks like that he cannot afford to fill my open order 🙂
I would say I have a good accumulated position now, even if it is about -10% in the negatives... I think the MM cannot keep this level forever... 🙂
Oops. while I was writing this it has moved to +4% 🙂
Now break-even...
...
I feel that the MM awaits me to close with about +2 to +6%... I can feel his frustration when I don't do what he awaits...
Dear MM, I had many such situations, I know how things work, just go on... don't wait for me...
_I_ decide when I want to close my positions, not you.
...
Yeah, now it's about +14% for me, there is more, even much more, possible... I'll wait more...
...
Yippeah! Now about +30%! I think I should close now...
Closed... about 40k profit 🙂
...
Bot some more AIG Puts 🙂 b/c pos was about -15% in the negatives... 🙂
...
Now only -3%... and keeps getting better...
...
Nope, again down to -9%...
...
-2% now...
...
+1% now
...
My stake is about 45k...
...
-3% now
...
-8% now.... 🙂
...
Hmmm. now -18% (!), unbelievable, that thing keeps rising and rising, and I bot Puts... 🙂
Keep cool boy...
Now -15%
I think I should prepare my next strategic buy at -20% or so...
...
have doubled it...
now -11%...
now -7%
...
finally in the positive area: +5.5%
...
-6%
shorted some AIG Calls
cumulated pos now -2.25%
...
hmm... doesn't look good... almost -10%
Ok, now I should simply lean back and wait, no more buying... whole stake is about 115k...
...
+2%
...
-11%... As it looks like I _must_ buy some more... an order is already out... not filled yet...
...
Hey, the MM offers me to close with a profit of +1.45% 🙂)) No thx MM! 🙂
Now he offers me +2.5%... Forget it man!
...
It looks like that he cannot afford to fill my open order 🙂
I would say I have a good accumulated position now, even if it is about -10% in the negatives... I think the MM cannot keep this level forever... 🙂
Oops. while I was writing this it has moved to +4% 🙂
Now break-even...
...
I feel that the MM awaits me to close with about +2 to +6%... I can feel his frustration when I don't do what he awaits...
Dear MM, I had many such situations, I know how things work, just go on... don't wait for me...
_I_ decide when I want to close my positions, not you.
...
Yeah, now it's about +14% for me, there is more, even much more, possible... I'll wait more...
...
Yippeah! Now about +30%! I think I should close now...
Closed... about 40k profit 🙂
Last edited:
(ctd)
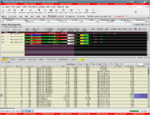
Here's a screenshot of the result of today (traded GE and AIG):
+102.8k (+20.56% of IAV 500k)
If anybody wants to study the trades, here they are, times are in CET:
Here's a screenshot of the result of today (traded GE and AIG):
+102.8k (+20.56% of IAV 500k)
If anybody wants to study the trades, here they are, times are in CET:
Code:
Underlying	SecurityType	Expiry	Strike	Put/Call	Action	Quantity	Price	Time	Date	Exch.
GE	OPT	JAN10	9	Call	BOT	10	2.97	08:19:03	20091224	BOX
GE	OPT	JAN10	9	Call	BOT	10	2.88	08:20:46	20091224	BOX
GE	OPT	JAN10	9	Call	BOT	10	2.82	08:21:35	20091224	CBOE
GE	OPT	JAN10	16	Put	SLD	10	4.7	08:31:01	20091224	BOX
GE	OPT	JAN10	16	Put	SLD	40	4.7	08:32:38	20091224	CBOE
GE	OPT	JAN10	9	Call	BOT	10	2.56	08:33:54	20091224	CBOE
GE	OPT	JAN10	9	Call	BOT	80	2.36	08:36:26	20091224	CBOE
GE	STK				BOT	1394	11.19	16:03:28	20091224	NYSE
GE	OPT	JAN10	9	Call	BOT	10	2.24	16:10:52	20091224	BOX
GE	OPT	JAN10	9	Call	BOT	50	2.22	16:13:44	20091224	CBOE
GE	STK				SLD	1394	11.58	16:32:36	20091224	ISLAND
AIG	OPT	JAN10	33	Put	BOT	40	2.78	18:11:03	20091224	BOX
GE	OPT	JAN10	9	Call	SLD	134	5.2	18:13:22	20091224	BOX
GE	OPT	JAN10	9	Call	SLD	46	5.2	18:13:25	20091224	BOX
GE	OPT	JAN10	16	Put	BOT	50	2.41	18:13:49	20091224	BOX
AIG	OPT	JAN10	33	Put	BOT	20	2.6	18:27:18	20091224	BOX
AIG	OPT	JAN10	33	Put	BOT	33	2.41	18:28:30	20091224	BOX
AIG	OPT	JAN10	33	Put	BOT	87	2.41	18:28:35	20091224	BOX
AIG	OPT	JAN10	33	Put	BOT	192	1.87	19:19:58	20091224	CBOE
AIG	OPT	JAN10	33	Put	BOT	168	1.86	19:19:58	20091224	BOX
AIG	OPT	JAN10	37	Call	SLD	40	2.7	19:49:11	20091224	CBOE
AIG	OPT	JAN10	37	Call	SLD	15	2.72	19:49:11	20091224	BOX
AIG	OPT	JAN10	33	Put	SLD	184	2.75	22:16:23	20091224	BOX
AIG	OPT	JAN10	37	Call	BOT	55	1.7	22:16:24	20091224	CBOE
AIG	OPT	JAN10	33	Put	SLD	32	2.75	22:16:24	20091224	BOX
AIG	OPT	JAN10	33	Put	SLD	32	2.75	22:17:54	20091224	BOX
AIG	OPT	JAN10	33	Put	SLD	196	2.75	22:17:55	20091224	BOX
AIG	OPT	JAN10	33	Put	SLD	10	2.75	22:18:02	20091224	BOX
AIG	OPT	JAN10	33	Put	SLD	32	2.76	22:18:11	20091224	BOX
AIG	OPT	JAN10	33	Put	SLD	30	2.76	22:18:14	20091224	BOX
AIG	OPT	JAN10	33	Put	SLD	24	2.76	22:18:15	20091224	BOX
Attachments
Last edited:
Ok, here I post something useful regarding options trading:
The columns "cprm0PL%" and "pprm0PL%" show the profit% one makes if the underlying moves "deltaSpot%" on day x.
An example: you think the underlying stock will rise in the coming days, so you buy 1 or more Call contracts (1 contract usually means 100 options representing 100 shares of the underlying stock or index).
From the table above you can see your profit% (column "cprm0PL%") for the corrosponding rise% (column "deltaSpot%") of the underlying. The profit is different for each day because the option loses time value each day. So the earlier the underlying reaches your target the more is the profit.
A volatility of 35% was used in this example. Volatility is the annualized standard deviation from the mean (--> consult your stats book, or see wikipedia).
Since here Strike equals the initial Spot it's called "At The Money", short ATM.
BTW, this is a theoretical model, in reality supply&demand makes the prices, but since most people use the Black-Scholes model it practically means the market uses the same model. The only discrepancy is that everybody has a different prediction of the future, ie. everybody uses a different volatility input with the formula... therefore theoretical prices as calculated by the Black-Scholes formula and market prices differ mostly... But the basic structure (ie. the relation) stays the same... and one can use the model well for trading strategies...
Hope it's somewhat useful for you.
Here's an online options calculator for verification etc: http://www.numa.com/derivs/ref/calculat/option/calc-opa.htm
PS: the program that generated the above table uses 253 trading days for the year, ie. omitting the weekends: that is: 20 trading days means about 30 calendar days, ie. a calendar month...
Code:
Development of the Option Premium in Standard Black-Scholes Option Pricing Model for the first 5 days of an option expiring in 20 trade days (assuming constant volatility) :

Spot=100.000 Strike=100.00 ExpDays=20 HoldDays=5 IRpct=0.000000% VolaPct=35.00000% -->  Call=3.924272  Put=3.924272

Day 1:
   deltaSpot%        spot         call         put            p/c        c/p        p-c        c-p        cprm0PL%      pprm0PL%    diffStrike    diff/spot%    diff/strk%    diff/cprm0%   diff/pprm0%
-------------------------------------------------------------------------------------------------------------------------------------------------------------------------------------------------------
     5.00000%     105.00000       7.00637      2.00637       0.286      3.492     -5.000      5.000      78.53926%    -48.87289%       5.00000      5.00000%      5.00000%      27.41215%     27.41215%
     4.00000%     104.00000       6.31622      2.31622       0.367      2.727     -4.000      4.000      60.95261%    -40.97712%       4.00000      4.00000%      4.00000%       1.92972%      1.92972%
     3.00000%     103.00000       5.66131      2.66131       0.470      2.127     -3.000      3.000      44.26398%    -32.18331%       3.00000      3.00000%      3.00000%     -23.55271%    -23.55271%
     2.00000%     102.00000       5.04341      3.04341       0.603      1.657     -2.000      2.000      28.51829%    -22.44658%       2.00000      2.00000%      2.00000%     -49.03514%    -49.03514%
     1.00000%     101.00000       4.46400      3.46400       0.776      1.289     -1.000      1.000      13.75365%    -11.72878%       1.00000      1.00000%      1.00000%     -74.51757%    -74.51757%
     0.00000%     100.00000       3.92427      3.92427       1.000      1.000      0.000     -0.000       0.00000%      0.00000%       0.00000      0.00000%      0.00000%    -100.00000%   -100.00000%
    -1.00000%      99.00000       3.42496      4.42496       1.292      0.774      1.000     -1.000     -12.72363%     12.75880%      -1.00000     -1.00000%     -1.00000%    -125.48243%   -125.48243%
    -2.00000%      98.00000       2.96653      4.96653       1.674      0.597      2.000     -2.000     -24.40571%     26.55916%      -2.00000     -2.00000%     -2.00000%    -150.96486%   -150.96486%
    -3.00000%      97.00000       2.54893      5.54893       2.177      0.459      3.000     -3.000     -35.04712%     41.40017%      -3.00000     -3.00000%     -3.00000%    -176.44729%   -176.44729%
    -4.00000%      96.00000       2.17169      6.17169       2.842      0.352      4.000     -4.000     -44.65998%     57.26975%      -4.00000     -4.00000%     -4.00000%    -201.92972%   -201.92972%
    -5.00000%      95.00000       1.83392      6.83392       3.726      0.268      5.000     -5.000     -53.26730%     74.14486%      -5.00000     -5.00000%     -5.00000%    -227.41215%   -227.41215%

Day 2:
   deltaSpot%        spot         call         put            p/c        c/p        p-c        c-p        cprm0PL%      pprm0PL%    diffStrike    diff/spot%    diff/strk%    diff/cprm0%   diff/pprm0%
-------------------------------------------------------------------------------------------------------------------------------------------------------------------------------------------------------
     5.00000%     105.00000       6.91668      1.91668       0.277      3.609     -5.000      5.000      76.25385%    -51.15831%       5.00000      5.00000%      5.00000%      27.41215%     27.41215%
     4.00000%     104.00000       6.22289      2.22289       0.357      2.799     -4.000      4.000      58.57434%    -43.35539%       4.00000      4.00000%      4.00000%       1.92972%      1.92972%
     3.00000%     103.00000       5.56510      2.56510       0.461      2.170     -3.000      3.000      41.81238%    -34.63491%       3.00000      3.00000%      3.00000%     -23.55271%    -23.55271%
     2.00000%     102.00000       4.94519      2.94519       0.596      1.679     -2.000      2.000      26.01557%    -24.94929%       2.00000      2.00000%      2.00000%     -49.03514%    -49.03514%
     1.00000%     101.00000       4.36474      3.36474       0.771      1.297     -1.000      1.000      11.22424%    -14.25819%       1.00000      1.00000%      1.00000%     -74.51757%    -74.51757%
     0.00000%     100.00000       3.82498      3.82498       1.000      1.000      0.000     -0.000      -2.53008%     -2.53008%       0.00000      0.00000%      0.00000%    -100.00000%   -100.00000%
    -1.00000%      99.00000       3.32670      4.32670       1.301      0.769      1.000     -1.000     -15.22760%     10.25483%      -1.00000     -1.00000%     -1.00000%    -125.48243%   -125.48243%
    -2.00000%      98.00000       2.87034      4.87034       1.697      0.589      2.000     -2.000     -26.85678%     24.10809%      -2.00000     -2.00000%     -2.00000%    -150.96486%   -150.96486%
    -3.00000%      97.00000       2.45583      5.45583       2.222      0.450      3.000     -3.000     -37.41945%     39.02785%      -3.00000     -3.00000%     -3.00000%    -176.44729%   -176.44729%
    -4.00000%      96.00000       2.08263      6.08263       2.921      0.342      4.000     -4.000     -46.92948%     55.00024%      -4.00000     -4.00000%     -4.00000%    -201.92972%   -201.92972%
    -5.00000%      95.00000       1.74973      6.74973       3.858      0.259      5.000     -5.000     -55.41250%     71.99965%      -5.00000     -5.00000%     -5.00000%    -227.41215%   -227.41215%

Day 3:
   deltaSpot%        spot         call         put            p/c        c/p        p-c        c-p        cprm0PL%      pprm0PL%    diffStrike    diff/spot%    diff/strk%    diff/cprm0%   diff/pprm0%
-------------------------------------------------------------------------------------------------------------------------------------------------------------------------------------------------------
     5.00000%     105.00000       6.82522      1.82522       0.267      3.739     -5.000      5.000      73.92327%    -53.48889%       5.00000      5.00000%      5.00000%      27.41215%     27.41215%
     4.00000%     104.00000       6.12748      2.12748       0.347      2.880     -4.000      4.000      56.14321%    -45.78652%       4.00000      4.00000%      4.00000%       1.92972%      1.92972%
     3.00000%     103.00000       5.46657      2.46657       0.451      2.216     -3.000      3.000      39.30151%    -37.14578%       3.00000      3.00000%      3.00000%     -23.55271%    -23.55271%
     2.00000%     102.00000       4.84447      2.84447       0.587      1.703     -2.000      2.000      23.44881%    -27.51605%       2.00000      2.00000%      2.00000%     -49.03514%    -49.03514%
     1.00000%     101.00000       4.26286      3.26286       0.765      1.306     -1.000      1.000       8.62793%    -16.85450%       1.00000      1.00000%      1.00000%     -74.51757%    -74.51757%
     0.00000%     100.00000       3.72304      3.72304       1.000      1.000     -0.000      0.000      -5.12783%     -5.12783%       0.00000      0.00000%      0.00000%    -100.00000%   -100.00000%
    -1.00000%      99.00000       3.22584      4.22584       1.310      0.763      1.000     -1.000     -17.79779%      7.68464%      -1.00000     -1.00000%     -1.00000%    -125.48243%   -125.48243%
    -2.00000%      98.00000       2.77170      4.77170       1.722      0.581      2.000     -2.000     -29.37045%     21.59441%      -2.00000     -2.00000%     -2.00000%    -150.96486%   -150.96486%
    -3.00000%      97.00000       2.36050      5.36050       2.271      0.440      3.000     -3.000     -39.84875%     36.59855%      -3.00000     -3.00000%     -3.00000%    -176.44729%   -176.44729%
    -4.00000%      96.00000       1.99162      5.99162       3.008      0.332      4.000     -4.000     -49.24858%     52.68114%      -4.00000     -4.00000%     -4.00000%    -201.92972%   -201.92972%
    -5.00000%      95.00000       1.66395      6.66395       4.005      0.250      5.000     -5.000     -57.59854%     69.81362%      -5.00000     -5.00000%     -5.00000%    -227.41215%   -227.41215%

Day 4:
   deltaSpot%        spot         call         put            p/c        c/p        p-c        c-p        cprm0PL%      pprm0PL%    diffStrike    diff/spot%    diff/strk%    diff/cprm0%   diff/pprm0%
-------------------------------------------------------------------------------------------------------------------------------------------------------------------------------------------------------
     5.00000%     105.00000       6.73189      1.73189       0.257      3.887     -5.000      5.000      71.54500%    -55.86716%       5.00000      5.00000%      5.00000%      27.41215%     27.41215%
     4.00000%     104.00000       6.02987      2.02987       0.337      2.971     -4.000      4.000      53.65565%    -48.27407%       4.00000      4.00000%      4.00000%       1.92972%      1.92972%
     3.00000%     103.00000       5.36554      2.36554       0.441      2.268     -3.000      3.000      36.72691%    -39.72038%       3.00000      3.00000%      3.00000%     -23.55271%    -23.55271%
     2.00000%     102.00000       4.74103      2.74103       0.578      1.730     -2.000      2.000      20.81286%    -30.15201%       2.00000      2.00000%      2.00000%     -49.03514%    -49.03514%
     1.00000%     101.00000       4.15812      3.15812       0.760      1.317     -1.000      1.000       5.95913%    -19.52330%       1.00000      1.00000%      1.00000%     -74.51757%    -74.51757%
     0.00000%     100.00000       3.61822      3.61822       1.000      1.000     -0.000      0.000      -7.79896%     -7.79896%       0.00000      0.00000%      0.00000%    -100.00000%   -100.00000%
    -1.00000%      99.00000       3.12216      4.12216       1.320      0.757      1.000     -1.000     -20.43973%      5.04270%      -1.00000     -1.00000%     -1.00000%    -125.48243%   -125.48243%
    -2.00000%      98.00000       2.67040      4.67040       1.749      0.572      2.000     -2.000     -31.95177%     19.01309%      -2.00000     -2.00000%     -2.00000%    -150.96486%   -150.96486%
    -3.00000%      97.00000       2.26276      5.26276       2.326      0.430      3.000     -3.000     -42.33928%     34.10801%      -3.00000     -3.00000%     -3.00000%    -176.44729%   -176.44729%
    -4.00000%      96.00000       1.89854      5.89854       3.107      0.322      4.000     -4.000     -51.62054%     50.30918%      -4.00000     -4.00000%     -4.00000%    -201.92972%   -201.92972%
    -5.00000%      95.00000       1.57648      6.57648       4.172      0.240      5.000     -5.000     -59.82752%     67.58464%      -5.00000     -5.00000%     -5.00000%    -227.41215%   -227.41215%

Day 5:
   deltaSpot%        spot         call         put            p/c        c/p        p-c        c-p        cprm0PL%      pprm0PL%    diffStrike    diff/spot%    diff/strk%    diff/cprm0%   diff/pprm0%
-------------------------------------------------------------------------------------------------------------------------------------------------------------------------------------------------------
     5.00000%     105.00000       6.63659      1.63659       0.247      4.055     -5.000      5.000      69.11632%    -58.29583%       5.00000      5.00000%      5.00000%      27.41215%     27.41215%
     4.00000%     104.00000       5.92988      1.92988       0.325      3.073     -4.000      4.000      51.10770%    -50.82202%       4.00000      4.00000%      4.00000%       1.92972%      1.92972%
     3.00000%     103.00000       5.26180      2.26180       0.430      2.326     -3.000      3.000      34.08352%    -42.36377%       3.00000      3.00000%      3.00000%     -23.55271%    -23.55271%
     2.00000%     102.00000       4.63464      2.63464       0.568      1.759     -2.000      2.000      18.10181%    -32.86306%       2.00000      2.00000%      2.00000%     -49.03514%    -49.03514%
     1.00000%     101.00000       4.05030      3.05030       0.753      1.328     -1.000      1.000       3.21141%    -22.27102%       1.00000      1.00000%      1.00000%     -74.51757%    -74.51757%
     0.00000%     100.00000       3.51026      3.51026       1.000      1.000     -0.000      0.000     -10.55004%    -10.55004%       0.00000      0.00000%      0.00000%    -100.00000%   -100.00000%
    -1.00000%      99.00000       3.01542      4.01542       1.332      0.751      1.000     -1.000     -23.15977%      2.32266%      -1.00000     -1.00000%     -1.00000%    -125.48243%   -125.48243%
    -2.00000%      98.00000       2.56622      4.56622       1.779      0.562      2.000     -2.000     -34.60647%     16.35839%      -2.00000     -2.00000%     -2.00000%    -150.96486%   -150.96486%
    -3.00000%      97.00000       2.16244      5.16244       2.387      0.419      3.000     -3.000     -44.89586%     31.55144%      -3.00000     -3.00000%     -3.00000%    -176.44729%   -176.44729%
    -4.00000%      96.00000       1.80324      5.80324       3.218      0.311      4.000     -4.000     -54.04896%     47.88076%      -4.00000     -4.00000%     -4.00000%    -201.92972%   -201.92972%
    -5.00000%      95.00000       1.48723      6.48723       4.362      0.229      5.000     -5.000     -62.10169%     65.31046%      -5.00000     -5.00000%     -5.00000%    -227.41215%   -227.41215%
The columns "cprm0PL%" and "pprm0PL%" show the profit% one makes if the underlying moves "deltaSpot%" on day x.
An example: you think the underlying stock will rise in the coming days, so you buy 1 or more Call contracts (1 contract usually means 100 options representing 100 shares of the underlying stock or index).
From the table above you can see your profit% (column "cprm0PL%") for the corrosponding rise% (column "deltaSpot%") of the underlying. The profit is different for each day because the option loses time value each day. So the earlier the underlying reaches your target the more is the profit.
A volatility of 35% was used in this example. Volatility is the annualized standard deviation from the mean (--> consult your stats book, or see wikipedia).
Since here Strike equals the initial Spot it's called "At The Money", short ATM.
BTW, this is a theoretical model, in reality supply&demand makes the prices, but since most people use the Black-Scholes model it practically means the market uses the same model. The only discrepancy is that everybody has a different prediction of the future, ie. everybody uses a different volatility input with the formula... therefore theoretical prices as calculated by the Black-Scholes formula and market prices differ mostly... But the basic structure (ie. the relation) stays the same... and one can use the model well for trading strategies...
Hope it's somewhat useful for you.
Here's an online options calculator for verification etc: http://www.numa.com/derivs/ref/calculat/option/calc-opa.htm
PS: the program that generated the above table uses 253 trading days for the year, ie. omitting the weekends: that is: 20 trading days means about 30 calendar days, ie. a calendar month...
Last edited:
Ok, today is Saturday and it's about 19:50 CET here.
As said, in this Demo it is possible to trade 23.5 hours/day, 7 days a week.
Some minutes ago I opened my first positions today: my old friend SPY again 🙂
My stake: about 2*20k, at the moment it's at break-even levels. TBC...
...
After being in the negatives (as usual 🙂, I of course didn't close with a loss, but accumulated more, ie. bought more 🙂
Now, after a while, my cumulated position consisting of 3 single positions (total stake about 62k) is about 20% in plus 🙂
But, since this is options trading things change so fast... Who knows what will be in the next 5 minutes... 🙂
...
BTW, the chart made a big U and I speculate that it now or soon should turn south... 🙂
...
More than 50% in plus!... and the chart looks good for even more... 🙂 Or am I maybe just too greedy?.. 🙂
...
now back to +35%... Never mind, I'll keep it some longer as I expect much more from this...
Last edited:
DionysusToast
Legendary member
- Messages
- 5,965
- Likes
- 1,501
The way your paper trading is going, I would not be suprised if you run out of paper soon.
I made yesterday more than 150k (!), 104.5k realized and 46.9 unrealized.
But, then at about 03:06 CET something weird has happend: clock, keyboard and mouse have frozen! So no input (keyboard or mouse, or switching to other apps) was possible anymore. Mouse moved normal but pressing its buttons had no effect.
So I could do nothing on the computer anymore.
But the quotes continued updating.
I decided to wait, and after exactly 30 minutes also the quotes stopped updating.
HD seemed to continue working because its red light periodically flashed up, meaning it read or wrote data to the HD. I decided to do nothing and go sleep.
When I awoke at about 09:00 CET things hadn't changed. So I had to hard reset the machine and so did I. Then I inspected the logs and they showed that the system worked normal (except the above said components), but I could not find the reason why these components stopped working.
It seems it was done by TWS. I'm analysing its log now.
Today the Demo System does not deliver any data anymore. I guess they have made some big changes to their servers at around the above said time.
Last edited:
Yeah right, it seems it even already happened 🙂 see the other posting.The way your paper trading is going, I would not be suprised if you run out of paper soon.
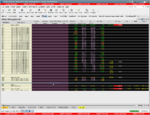
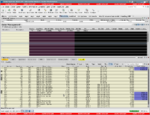
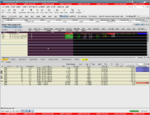
Here's a screenshot of today which shows the trades I had made yesterday and the realized PnL (see the Trades pane).
Right before the system froze I had placed GTC closing orders (I wrote these data from the screen on a paper because making a screenshot wasn't possible since keyboard not worked anymore as said in previous posting):
SPY 100 Call: qty=-80 avgprice=4.31275 BuyOrder @ 2.10
SPY 105 Put: qty=120 avgprice=3.40367 SellOrder @ 5.95
SPY 107 Put: qty=200 avgprice=2.2545 SellOrder @ 5.00
GE 5 Call: qty=20 avgprice=8.057
Exactly when I wanted to place a closing GTC order also for the last open position, GE, the system froze,
so for GE no closing order could be placed.
These are the latest acct and porfolio data my program has received via the API and has logged:
20091227-03:33:11 AU Key=NetLiquidation-S Val=651405.20 Currency=USD AcctName=DU15006
20091227-03:33:11 AU Key=GrossPositionValue-S Val=187180.00 Currency=USD AcctName=DU15006
20091227-03:33:11 AU Key=NetLiquidation Val=651405.20 Currency=USD AcctName=DU15006
20091227-03:33:11 AU Key=BuyingPower Val=1338372.83 Currency=USD AcctName=DU15006
20091227-03:33:11 AU Key=GrossPositionValue Val=187180.00 Currency=USD AcctName=DU15006
20091227-03:33:11 AU Key=InitMarginReq-S Val=202351.99 Currency=USD AcctName=DU15006
20091227-03:33:11 AU Key=MaintMarginReq-S Val=202351.99 Currency=USD AcctName=DU15006
20091227-03:33:11 AU Key=AvailableFunds-S Val=334593.21 Currency=USD AcctName=DU15006
20091227-03:33:11 AU Key=InitMarginReq Val=202351.99 Currency=USD AcctName=DU15006
20091227-03:33:11 AU Key=MaintMarginReq Val=202351.99 Currency=USD AcctName=DU15006
20091227-03:33:11 AU Key=AvailableFunds Val=334593.21 Currency=USD AcctName=DU15006
20091227-03:33:11 AU Key=LookAheadInitMarginReq-S Val=202351.99 Currency=USD AcctName=DU15006
20091227-03:33:11 AU Key=LookAheadMaintMarginReq-S Val=202351.99 Currency=USD AcctName=DU15006
20091227-03:33:11 AU Key=LookAheadAvailableFunds-S Val=334593.21 Currency=USD AcctName=DU15006
20091227-03:33:11 AU Key=LookAheadInitMarginReq Val=202351.99 Currency=USD AcctName=DU15006
20091227-03:33:11 AU Key=LookAheadMaintMarginReq Val=202351.99 Currency=USD AcctName=DU15006
20091227-03:33:11 AU Key=LookAheadAvailableFunds Val=334593.21 Currency=USD AcctName=DU15006
20091227-03:33:11 AU Key=FullInitMarginReq-S Val=202351.99 Currency=USD AcctName=DU15006
20091227-03:33:11 AU Key=FullMaintMarginReq-S Val=202351.99 Currency=USD AcctName=DU15006
20091227-03:33:11 AU Key=FullAvailableFunds-S Val=334593.21 Currency=USD AcctName=DU15006
20091227-03:33:11 AU Key=FullInitMarginReq Val=202351.99 Currency=USD AcctName=DU15006
20091227-03:33:11 AU Key=FullMaintMarginReq Val=202351.99 Currency=USD AcctName=DU15006
20091227-03:33:11 AU Key=FullAvailableFunds Val=334593.21 Currency=USD AcctName=DU15006
20091227-03:33:11 AU Key=OptionMarketValue Val=114460.00 Currency=USD AcctName=DU15006
20091227-03:33:11 AU Key=NetLiquidationByCurrency Val=651405.20 Currency=USD AcctName=DU15006
20091227-03:33:11 AU Key=OptionMarketValue Val=114460.00 Currency=BASE AcctName=DU15006
20091227-03:33:11 AU Key=NetLiquidationByCurrency Val=651405.20 Currency=BASE AcctName=DU15006
20091227-03:33:11 PU AcctName=DU15006 Ticker=GE Type=OPT Qty=20 MktPrice=8.0400 MktVal=16080.0000 AvgCost=805.7000 UPL=-34.0000 RPL=0.0000
Expiry=20100115 Strike=5.00 Kind=C Multiplier=100 Exchg= Crncy=USD localSym=GEWAE PrimExchg=AMEX ConId=48080321 secIdType= secId=
20091227-03:33:11 PU AcctName=DU15006 Ticker=SPY Type=OPT Qty=-80 MktPrice=4.5450 MktVal=-36360.0000 AvgCost=431.2750 UPL=-1858.0000 RPL=0.0000
Expiry=20100115 Strike=100.00 Kind=C Multiplier=100 Exchg= Crncy=USD localSym=SWGAV PrimExchg=AMEX ConId=69697899 secIdType= secId=
20091227-03:33:11 PU AcctName=DU15006 Ticker=SPY Type=OPT Qty=120 MktPrice=3.9700 MktVal=47640.0000 AvgCost=340.3667 UPL=6796.0000 RPL=0.0000
Expiry=20100115 Strike=105.00 Kind=P Multiplier=100 Exchg= Crncy=USD localSym=SWGMA PrimExchg=AMEX ConId=69697998 secIdType= secId=
20091227-03:33:11 PU AcctName=DU15006 Ticker=SPY Type=OPT Qty=200 MktPrice=4.3550 MktVal=87100.0000 AvgCost=225.4500 UPL=42010.0000 RPL=0.0000
Expiry=20100115 Strike=107.00 Kind=P Multiplier=100 Exchg= Crncy=USD localSym=SWGMC PrimExchg=AMEX ConId=69698005 secIdType= secId=
Attachments
Last edited:
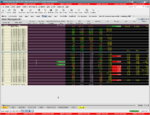
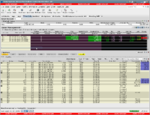
UPDATE: Demo has started to work again! Data coming in now! 🙂
Attached are the latest quotes of SPY and GE...
It seems GE is about 75% in plus, and of SPY only one of the remaining open positions is in plus, the other 2 are in minus.
Attached are the latest quotes of SPY and GE...
It seems GE is about 75% in plus, and of SPY only one of the remaining open positions is in plus, the other 2 are in minus.
Attachments
Last edited:
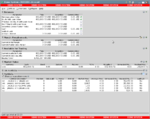
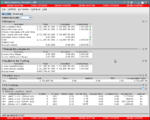
Today (Monday) I tried and tested IB's "Advisor Account" type. Ie. as an advisor you can manage and trade multiple accounts in the same platform.
The demo advisor account had 4 accounts with 10k + 3 * 500k = 1.51M, meaning a combined DTBP of about 6M.
I found some bugs in it (didn't let me buy more although enough capital was available; it was a "nan"-bug, ie. floating-point "not a number"-bug in the program).
Because of this bug I missed some good opportunities.
Nevertheless in the end I had made a plus of about 200k. That's about 13% of 1.5M.
Attached is a screenshot. Yes, again SPY used to be very profitable 🙂
Another disadvantage of the Advisor Account: my external program which uses the TWS API did not get any account updates, portfolio updates, nor the open orders; ie. here the Advisor Account differs much against the normal single account.
No, I'm not going to continue using the Advisor Account as the single account is sufficient for my current needs.
Attachments
Last edited:
Performance of the best fund manager James Simons
Performance of the best fund manager James Simons
"Renaissance Technologies is a hedge fund management company of 186 employees and more than $15 billion in assets under management in three funds.
Started in 1982 by James Simons, Renaissance currently has more than $15 billion in assets under management.[3] Since 1989, the company's $5 billion Medallion Fund has averaged 35% annual returns, after fees, and the Medallion Fund is said to be one of the most successful hedge funds.
For the 11 years ending in December 1999, Medallion’s cumulative returns were 2,478.6 percent. Among all offshore funds over that same period, according to the database run by hedge fund observer Antoine Bernheim, the next-best performer was George Soros’ Quantum Fund, with a 1,710.1 percent return. A measurement of the risk (e.g., beta, volatility, or leverage figures) which accompanied its high annual returns is not publicly available."
(Source: http://en.wikipedia.org/wiki/Renaissance_Technologies)
As mentioned above the cumulative return for the 11 years is 2478.6%.
This means about 34.37% annually, 2.49% monthly, and 0.57% weekly.
Hmm. I think I can make much more than 2.49% monthly, can't I? 🙂
Come on, the above statistics even goes only upto 1999, ie. it was the best years for trading since in that period everyone could have, and has, won in the markets...
Here are some other citations from other postings:
"Math whiz Simons, who made $1.7 billion to repeat as No. 1, has assembled an army of rocket scientists to build complex computer models that rapidly trade markets around the world, hoping to exploit tiny price changes."
"34 percent annualized net return since 1988 . They charge a hefty 5% annual fee and 44% performance fee ."
"In 2008 James Symons was the top earner with $2.5 billion amongst the top trader. He has done it year after year for over two decades. What this proves is automated /computer models work better than the brain in trading."
"Jim Symons is the world’s greatest trader. Jim simons has held top position among the top earners for over 1 decade. What makes a great trader is consistency in earnings , year after year.Ex-Math Professor Is America's Highest Earner."
Last edited:
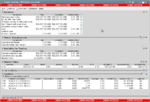
Here the trades of yesterday (Monday). Options of SPY and DRI.
This posting is an addendum to this posting:
http://www.trade2win.com/boards/tra...a-traderum-using-demo-acct-5.html#post1015160
This posting is an addendum to this posting:
http://www.trade2win.com/boards/tra...a-traderum-using-demo-acct-5.html#post1015160
Attachments
Last edited:
Similar threads
- Replies
- 174
- Views
- 29K
- Replies
- 37
- Views
- 10K