Joey's MP Journal

Status
Not open for further replies.
Numbers for use August 19th

1373.92 (Weekly R3)

1343.25 (Resistance)

1334.92 (Weekly R2)

1328.75 (Resistance)

1317.33 (Weekly R1)

1316.75 (Resistance)

1310.00 (Resistance)


1295.92 (Weekly Pivot Point)

1294.50 (Resistance)

1287.33 (Daily Pivot Point)


1278.33 (Weekly S1)

1256.92 (Weekly S2)

1217.92 (Weekly S3)
 
alternative PPs for 19 aug

Camarilla
H4 - 1299.50
H3 - 1290.80
L3 - 1273.20
L4 - 1264.40

DeMark
DMH - 1294
(PP - 1284)
DML - 1262

Crabel
ORB Strectch - 4.6
 
alternative PPs for 20 Aug

Camarilla
H4 - 12979.64
H3 - 1274.07
L3 - 1262.93
L4 - 1257.06

DeMark
DMH - 1275.75
(PP - 1269.25)
DML - 1255.50

Crabel
ORB Strectch - 4.5
 
alternative PPs for 21 aug

Camarilla
H4 - 1282.69
H3 - 1278.22
L3 - 1269.28
L4 - 1264.88

DeMark
DMH - 1283.38
(PP - 1271.94)
DML - 1267.13

Crabel
ORB Strectch - 4.5
 
A good six or seven months on, and I'm going to start posting in here again. :)

I continue to trade FTSE futures and options as my income, and trade S&P500 in a spreadbetting account as something "untouchable" which will hopefully compound. I've also got a demo account with Alpari for FX.

The entries haven't changed much, but hopefully it should be clear I'm now a lot more aggressive with exits.

Largely still Market Profile, with some Making Money Trading influences. I hope someone will find something of value.
 
look forward to reading your posts, will you be walking us through how you trade now or should i just read the journal from the start?
 
look forward to reading your posts, will you be walking us through how you trade now or should i just read the journal from the start?

Hi Elefteros,

I'll walk through some examples, past and present.

The basic routine is:

(i) Take a cue from the daily chart, which will usually be a potential reversal point.

(ii) Then, use the profile to identify area(s) to fade.

(iii) Finally, use the options market / VIX for range estimation and hence targetting.

For the time being, I virtually trade without stops - just using disaster ones. I'm trying to master the bigger picture before focussing too heavily on risk management.

I'll type up a complete example from the 10th February e-mini S&P later.
 
ES 10th Feb Example

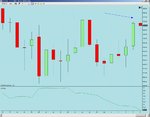
The first alert is the failed aution through the Feb 8th highs after a decent move up.

There is also a small value area of only about 6pts, which in the context of recent market activity is very small. The market could well be ready for a directional move.

At this point we take our vol readings, average range numbers or ATR measurement to gain an estimate for expected range. Some people extend yesterday's range, but I think this can lack ambition since the best moves come after a sudden contraction in range (signifying indecision).

The 20-day ATR on the chart is about 30 pts.
 

Attachments

  • PotentialReversal.jpg
    PotentialReversal.jpg
    67.4 KB · Views: 146
10th Feb Example Continued

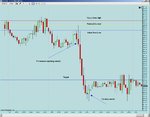
The market opens at 8:30am (14:30pm GMT) below the value area.

A market opening out of balance offers both great risk and great reward.

The strategy is to have 2 sell limit orders, one at the Value Area Low and one at the Point of Control.

In this example, the market reverses exactly at the Point of Control.

Our target is measured from the intraday high, so can be trailed towards us if the market rises further before falling.

Stops and trailing are a personal thing, but I will tend to cancel the Point of Control order if the market reverses straight away from the Value Area Low and a swing high forms before the other order is hit.
 

Attachments

  • EntriesAndExits.jpg
    EntriesAndExits.jpg
    107.2 KB · Views: 159
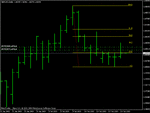
Cable Balance Areas

Cable Balance Areas for use 18th Feb

Balance Area 1

Upper Edge = 1.4501
Mean = 1.4388
Lower Edge = 1.4344

Balance Area 2

Upper Edge = 1.4280
Mean = 1.4242
Lower Edge = 1.4210

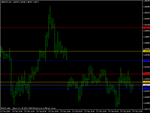
I'm particularly focussing on the lower edge of the upper balance area (1.4344), which is just below last week's untested close.
 

Attachments

  • cablebalance.gif
    cablebalance.gif
    10.9 KB · Views: 159
newbie question,

How do you calculate your balance areas?

The first step is to identify the places with the highest frequency of candles - in this case 60-minute for GBPUSD.

Then you can use your own arbitrary rules for the edges, such as >= 3 overlapping candles or >= 4 overlapping candles, so that you exclude areas which lack development.

Another alternative is as per the spreadsheet I have attached in post #2 of this thread.

The areas should really stand out when you compress the chart. The drill to go through is to let your eyes rotate from the bottom of areas of congestion to the top and then back down again. Then move to the right and see if the same rotation occurs later on.

In the above chart, if you do that on the 12th and then move rightwards, hopefully you can see the market "rotating" through the same zone. What has happened is that the upper balance area has been rejected and the market is naturally finding balance in the previous area - it is rare for it to pass straight through the lower one again without a pause for breath .
 
Last edited:
Following on from post #171, I entered the following orders:

Sell limit @ 1.4272 (Top of Lower Balance Area)
Sell limit @ 1.4336 (Bottom of Upper Balance Area)

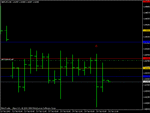
I've subsequently been filled on the first order and the market has travelled entirely through the lower balance area.

If, as appears likely, the H4 candle closes below this balance area, I will cancel the pending order and place a stop above the top of the lower balance area.

The theory behind this is that the market may retrace and test the lower edge and even the mean again, but if it gets as far as the upper edge then something has changed and the short is no longer valid.

Otherwise, run until close.
 

Attachments

  • stoptrail.gif
    stoptrail.gif
    9 KB · Views: 159
Update

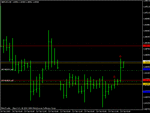
In the next H4 candle, price has retraced to both the lower edge and the mean (see post #174), but then stalled.

The stop remains intact, and price is trading below the Lower Balance Area again.
 

Attachments

  • update.gif
    update.gif
    9.3 KB · Views: 141
While this decides what it wants to do, I'll write up the levels for use tomorrow. No change really:

Cable Balance Areas for use 19th Feb

Balance Area 1

Upper Edge = 1.4501
Mean = 1.4388
Lower Edge = 1.4344

Balance Area 2

Upper Edge = 1.4270
Mean = 1.4245
Lower Edge = 1.4193
 
Cable Trade 19th Feb

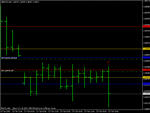
Difficult trade this one - filled with short orders at the Lower Balance Area upper edge and at the Upper Balance Area lower edge.

At the close of the H4 candle, price has closed outside the Lower Balance Area after testing the mean.

Therefore, I have set targets at the lower edge of the Lower Balance Area, reflecting the realsitic downside limit for the day (if I were long the stop would now be trailed below this edge).

Not a good trade, but I intend this to be a "warts and all" journal.
 

Attachments

  • 19thfebcable.gif
    19thfebcable.gif
    10.4 KB · Views: 126
The latest H4 candle has closed back below Balance Area 1, in between the two balance areas.

Therefore, the "disaster" / volatility stops have been moved to just above the upper edge of Balance Area 1, with targets at the bottom edge of Balance Area 2.

Otherwise, run until close.

Meanwhile, the updated levels for tomorrow are:

Cable Balance Areas for use 20th Feb

Balance Area 1

Upper edge = 1.4501
Mean = 1.4388
Lower edge = 1.4344

Balance Area 2

Upper edge = 1.4259
Mean = 1.4235
Lower edge = 1.4183
 
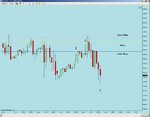
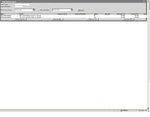
S&P500 Daily Future (Thursday)

Trade 1 (Lower Edge)

Sold @ 788.0
Bought @ 779.5
P/L = + 8.5

Trade 2 (Mean)

Sold @ 791.8
Bought @ 779.5
P/L = +12.3

Total P/L = +20.8
 

Attachments

  • 19thFebES.jpg
    19thFebES.jpg
    73.8 KB · Views: 153
  • ticket.jpg
    ticket.jpg
    35.7 KB · Views: 140
Planned Cable Trades for Friday

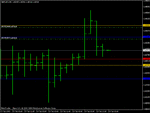
Quite a lot going on with Cable, and today marks the introduction of TPs based on value areas.

On the Daily chart a pin has just formed off a 38.2% retracement, but more importantly through the mean of Balance Area 1.

I have two orders in as usual, one at the lower edge and one at the mean, but also two TPs at the lower edge of Balance Area 2.

As a "map" of value is gradually constructed, we can work off the principle that price is unlikely to pass through or "reject" two successive balance areas in one session. Therefore targets are set (unless you are a position trader in which case you can use them for stop trailing) at adjacent value areas.

The sell limit orders happen to be roughly in line with a 50% retrace of that Daily Pin, so a lot of confluence going on.
 

Attachments

  • daily.gif
    daily.gif
    9.6 KB · Views: 139
  • neworders.gif
    neworders.gif
    9.5 KB · Views: 147
Status
Not open for further replies.
Top