rathcoole_exile
Guest Author
- Messages
- 3,925
- Likes
- 767
thanks, sorry to hijack your thread a wee bit there, but i knew you'd be the one guy to understand, our trading methods are so similar 🙂
thanks, sorry to hijack your thread a wee bit there, but i knew you'd be the one guy to understand, our trading methods are so similar 🙂
which reversal trades to take and which to leave alone.
rath, joey
u guys ever tried using rolling pivots where you put 3/5 candles together and do the calculations on the group candle 1 been the open and last been the close, high/low been the top and bottom of the group.
Would also like to know what you guys do to filter down which reversal trades to take and which to leave alone. If its ok with you joey i can post charts. Seeing as the 3 of us are all working around pivot points it might be better to put all our ideas into one thread.
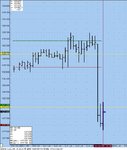
well on the mini dow i look for reversals off the pivots that will result in a 40 to 60 point move. I cant go for 5,6 points as the spread + stop losss will kill me. (4 point spread when spread betting.
untill i can figure out a way of filtering out some of the losing trades i'm not gonna be able to trade them. the lines on the charts were all drawn at the start of each hour, broken lines are points that if crossed i will only take a trade in that direction full lines are where i look for the reversal.
Joey,
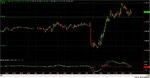
i've been investigating deMark pivots as well as camarilla, in addition to the standard floor trader PPs.
look how well today's action corresponded to deMark.........but, since I was in the pub and didn't have chance to update my charts, these are YESTERDAY'S pivot points !!!!! hmmmmmm................ curiouser and curiouser .....
(dashed upper and lower lines are deMark Hi & LO, dotted line is deMark Pivot Point..)