I constantly study methods of trading and consider myself to be a student of the market. I was surprised to learn that there are different methods of applying popular indicators and I found that by making some minor modifications, an indicator I previously had no use for became a nearly indispensible tool in my trading arsenal. One tool that fits this description is the Relative Strength Index.
As part of my market studies, I came across a book by Connie Brown entitled, Technical Analysis for the Trading Professional. In this book, Connie describes a method of adjusting signals of the RSI for maximum efficiency.
The typical Relative Strength Index (RSI) calculation uses 14 periods. This means that the strength of the current price is measured against the prices over the preceding 14 time periods. The indicator measures the strength of upward movements in price as well as the strength of downward moves in price. The RSI can be applied to any trading security and positive and negative divergences are the strongest signals provided by the indicator.
Positive divergence occurs when the indicator makes higher lows while the security’s price makes lower lows. In this case, the RSI is telling us the downward price movement is losing strength. Generally, the price will reverse and head higher. A negative divergence is when the indicator fails to make new highs while price does. This tells us that the upward trend is weakening. Generally, the price will fail and enter a downtrend. Unfortunately, divergence signals do not give us exact timing for the reversals in price but simply warn that one may be coming.
The RSI also provides a good indicator of a market’s overbought and oversold status. If the indicator rises above 70, the security is considered overbought and is ready for a pullback or reversal. Do not automatically sell a long position at this point! If the RSI drops below 70 after moving above it, that is the signal to exit a long position or initiate a short one in a bearish market.
A similar signal occurs when the indicator drops below 30. When this occurs, the market is oversold and may reverse to the upside. Wait to buy when the indicator crosses back above 30. If you are short the market, buy to close the position. If opening a long position, be sure that the market is in a bullish trend before entering the long position.
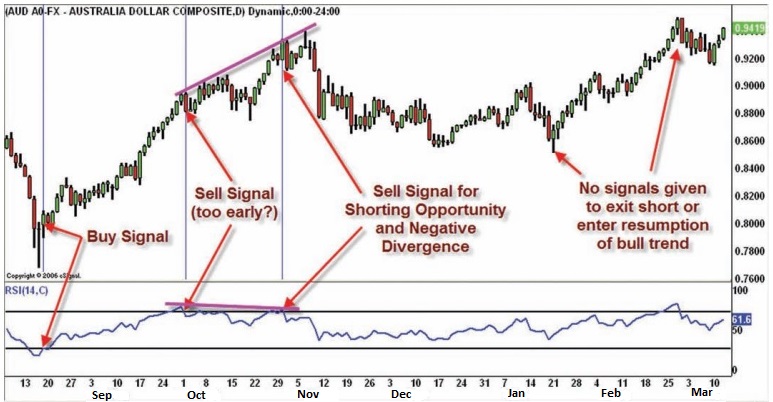
Fig 1 Source: Procharts
Shown in Figure 1, there is a nice buy signal on the left side of the chart from the RSI going long the AUD/USD at approximately 0.80. We are able to ride the trend up and exit from the position on the sell signal at 0.89 for a nice profit. Unfortunately, the RSI exits the position too early and the pair rises while we wait for another buy signal that never arrives. The price continues to make higher highs while the RSI shows negative divergence. On the break of the RSI below 70, a short can be entered but the RSI fail and never offers a signal to exit the trade or to participate in the following rally.
One thing to notice is that in a very bullish trend, buy signals are rare since the RSI does not drop below 40. In a very bearish trend, the RSI will not move above 60. In this scenario, how can you hope to have the 70 – 30 signals needed to get you into trades? The answer is that you cannot unless the indicator is adjusted. Many trading platforms will allow you to adjust the lines for overbought and oversold indications. Let’s see how this adjusts our trading signals.
In a bullish trend, I mentioned that the RSI does not drop below 40. In this case, we can use a reading of 40 as an area of support to tell us when the bear market is ending. We can also adjust our overbought and oversold signal lines upward to provide quality signals. By making the overbought line 80 and the oversold 40, you will have a useful indicator. Do not enter any short positions against a bullish trend! Use the overbought signal to exit trade longs only, not enter short positions.
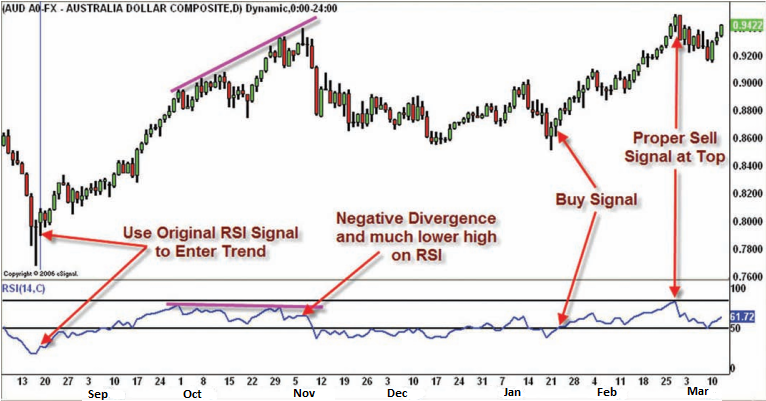
Fig 2 Source: Procharts
In Figure 2, the RSI has been adjusted for a bullish trend and provides better quality signals that allow participation in the trend. We will still use the original RSI buy signal but then exit the trade for a larger profit at approximately 0.94 when the RSI makes a much lower peak while the AUD made new highs against the USD. Once price and the RSI begin dropping, we take that as a signal to exit with a profit but do not short the market as the RSI remains above 40. The adjusted RSI allows us to enter another profitable trade in January. We see a great buy signal near the lows and a sell signal near the highs.
When the RSI drops below 40, it is time to adjust the RSI for a bearish trend. In a bearish trend, the RSI uses 60 as resistance. So, we adjust our signal lines downward. Our overbought line becomes 50 and our oversold is 25. Sell short on a crossover from above 50 to the downside and exit shorts on the crossover of 25 to the upside. Do not enter longs against a bearish trend. Remember, the trend is your friend!
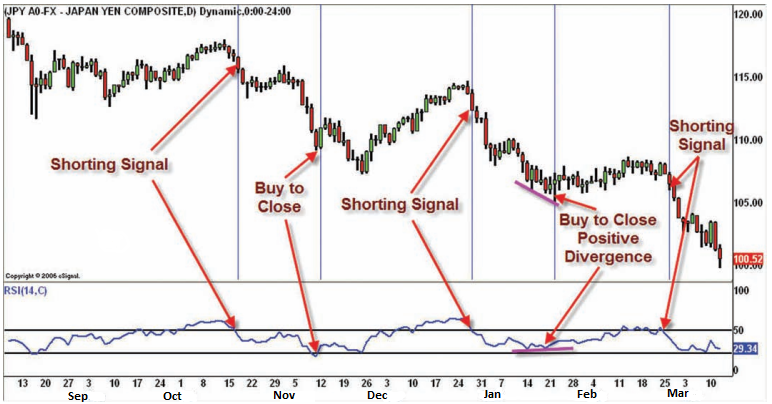
Fig 3 Source: Procharts
In the chart of the USD/JPY pair, I have identified a nice downtrend and have adjusted the RSI for proper signals. We were able to sell the pair successfully with the adjusted RSI and exited for profit with timely signals or divergence.
I have shown examples on daily charts only. Do not worry, this technique works just as well intraday on stocks as well as for Forex, E-minis and anything else you can use an RSI on. Give it a try and see if you get better signals!
Brandon Wendell can be contacted on this link: Brandon Wendell