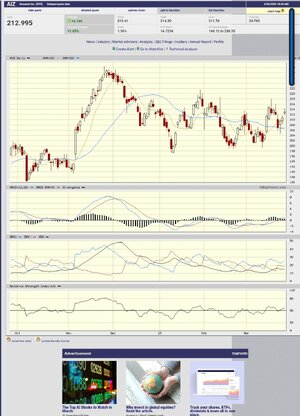
To determine whether the pattern is a symmetrical triangle or a rising wedge, it's essential to analyze the chart's trendlines and price action carefully:
- **Symmetrical Triangle:** This pattern is characterized by converging trendlines—one descending and one ascending—that come together at a point, indicating a period of consolidation. Typically, volume decreases as the pattern develops, and a breakout can occur in either direction, signaling potential continuation of the prior trend.
- **Rising Wedge:** This pattern features two converging trendlines, with both ascending but the upper trendline steeper than the lower. It often indicates a potential bearish reversal, especially if it forms after an uptrend, as price action becomes more compressed before a breakdown.
**Key considerations:**
- **Trendline slopes:** Check whether both trendlines are converging with upward slopes (rising wedge) or if one is ascending and the other descending (symmetrical triangle).
- **Volume:** Observe volume patterns—symmetrical triangles often see decreasing volume, while rising wedges may also show volume decline before a breakdown.
- **Breakout direction:** The pattern's breakout direction can provide clues—rising wedges typically break downward, whereas symmetrical triangles can break in either direction.
Without seeing the chart, I recommend plotting the trendlines carefully, noting their slopes and convergence point. If both lines are converging with upward slopes, it's likely a rising wedge. If one slopes up and the other down, forming a symmetrical shape, then it's a symmetrical triangle.
Feel free to share the chart or more details for a more precise analysis!