is a bullish pin bar still bullish if it is red and not green?
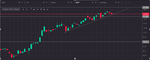
the stock I'm watching (BMW) closed today with a bullish pin bar on the upward trend line, trouble is it is red and not green.
is the probability of it rising further still quite strong? 😱
the stock I'm watching (BMW) closed today with a bullish pin bar on the upward trend line, trouble is it is red and not green.
is the probability of it rising further still quite strong? 😱