intraday implied volatility

dewitte

Junior member
Messages
28
Likes
0
I have been searching for an application that can plot real time implied volatilities, separately for bid and ask . For some reason this is hard to find . I have been swing trading options but for intraday trading I feel I'd be trading blind if I don't have any indication of the relative IV level . Any suggestions? Thanks.

-dewitte
 
An impressive set of option tools , but I could find no reference to what I am looking for . I have sent an email to peter hoadly . Thanks for the tip, Glenn .

-dewitte
 
Nope , Peter Hoadley does not have it . I'm beginning to think it just does not exist and that amazes me: one can easily save 5¢ or more and possibly even scalp profitably just by keeping an eye on iv.

Other suggestions or links to software that can do this would be appreciated . Thanks in advance .

-dewitte
 
dewitte,

Do you know what the formula is to get the implied volatility as I would have thought that Tradestation may be able to do it ? Also depending upon the formula, Excel may be another possibility.


Paul
 
dewitte said:
I have been searching for an application that can plot real time implied volatilities, separately for bid and ask . For some reason this is hard to find . I have been swing trading options but for intraday trading I feel I'd be trading blind if I don't have any indication of the relative IV level . Any suggestions? Thanks.

-dewitte

I've written my own real-time programme for options on indices in Excel. And it is a laborious exercise. Perseverance is the key. However, once completed you may agree with me that trading volatility is the best strategy for options.

Some feeds provide iv's but is questionable - constant volatility (where's the smile?), wrong model (Black-Scholes for futures options). I suspect this facility is available from the better providers - Reuters, Bloomberg - but it isn't cheap.

Let me know if I can provide more details.
 
Grant said:
I've written my own real-time programme for options on indices in Excel. And it is a laborious exercise. Perseverance is the key. However, once completed you may agree with me that trading volatility is the best strategy for options.

Some feeds provide iv's but is questionable - constant volatility (where's the smile?), wrong model (Black-Scholes for futures options). I suspect this facility is available from the better providers - Reuters, Bloomberg - but it isn't cheap.

Let me know if I can provide more details.

Hi Grant
Which data feed are you using as input to Excel ? Mytrack ?

I have a real-time spreadsheet (care of a friend) which uses Mytrack data for FTSE (European-style)

Would be interested in inserting an IV engine if you have the code.
Glenn
 
Glenn said:
Hi Grant
Which data feed are you using as input to Excel ? Mytrack ?

I have a real-time spreadsheet (care of a friend) which uses Mytrack data for FTSE (European-style)

Would be interested in inserting an IV engine if you have the code.
Glenn

Glenn,

Not quite as simple as that - it's a question of magnitude.

Re the FTSE. You will be looking around twenty strikes (or more) per expiry x 2 (bid and ask) x 2 (puts and calls) x 3 (at least) expiries = 240 separate implied calculations. Plus 240 dde's.
Next (although not in a strict order), you need to determine whether the premiums (bid/ask) are at a discount, ie trading below intrinsic value, or zero iv. If so, iv cannot be determined. Then you have to overcome the limitations of Excel.

However, once completed, it can be applied to any index - FTSE, DAX, STOXX, CAC, SMI and and those in the colony across the pond.

A slightly simpler version - and just as useful - would simply calculate iv's of last trades. Or implieds derived from the mid (although the validity of the results with far out-or-the-money options - in percentage terms, big spreads - may be questionable). And combining the two (although duplication would not be total) would show whether there were any buyers (sellers) at a particular implied; if not, would the premiums be lowered (raised)?

Then you need to identify and isolate the best potential positions (or strategies if you use these). And on it goes.

Send me your e-mail and I'll supply an Excel example for calculating IV (only one option per time). It would be straightforward to run it real-time via dde. If you want the main programme, you'll need to re-mortgage (but I'll help where I can).
 
Guys, thanks for the input.

First off, I am a math guy but not a programmer.

The regular approach to calculating implied volatility is a Newton Raphson search. This is an iteration that tends to be rather time consuming. There are however complex analytical approximations that do a fast and excellent job as long as the inputs are not too extreme (like way out of the money or close to expiration). I am familiar with the latest developments in this field.

My interest is not in calculating an index’s IV but real-time plotting IV on one contract. Getting the data in Excel is not a problem but how do I convert these constantly updating cells into a real-time chart? I guess this is primarily an Excel/VBA issue.

Btw here is a free Excel add-in that calculates IV and Greeks using iterations (bottom of page zip file)

http://www.iimahd.ernet.in/~jrvarma/software.html#download

though I expect that a fast iv approximation will be necessary for the charts especially when following multiple contracts. I may be wrong but I think iterations simply won’t keep up with the real-time data.

Reading the above posts, I am wondering if there are programmers among us interested in co-developing this?

-dewitte
 
A Bloomberg terminal will be able to plot a chart of historic vols on FTSE, and can also calculate real-time IV.

As mentioned before, Bloomberg terminal probably excessively expensive for most punters.

I had the fortune to use it for many years when employed by a broking firm, but too expensive a tool to purchase trading on my tod!
 
Several feeds provide real time iv’s but as Grant pointed out these may not be too reliable. Furthermore most feeds miss the point (well, my point) and provide only one iv based on bid/ask average. I was informed that RealTick has separate bid and ask iv but that it is not possible to plot these. My own photographic memory fails in making something out of a cell’s data popping up and down without any visual reference to past values.

IMO all that would be needed to use any one of the existing charting applications to calculate and plot iv’s would be the ability to:

-define custom indicators
-use more than one securities’ data in one indicator (in this case reference the underlying stock’s last trade)
-use a securities’ (the option’s) BID and ASK in the indicator definition (instead of OHLC)

Question to Paul (Trader333): can Tradestation do all three?

-dewitte
 
This is too easy.......numerically invert the BS76 formula and 'imply' the volatility used by the means of say the bisection method (quick and accurate)......I use Kobra and excel and I have the IV for all options in the market from which I can create a vol surface.....
Being a maths (like my good self) you should easily be able to program such a simple algorithm in VB in excel..........plus if you use third party stuff then there might be flaws in the code!!!!!

One uses the BS as the market assumes it when calculating the IV......it doesn't matter if you are running a stoch vol maodel to price, as if you are implying the vol from the market everyone uses BS to do this.....Grant is getting confused on this issue as the smile is implied by the market.......Grant if you need any help with this give me a shout.....What model do you use to imply your vol???? smile when implying a vol!!!!!! he he he he

Also what is this about zero vol if the price is purely intrinsic??? Yeah near expiry.....what about if we have 6 month to go and you are OTM....??? you will be pure time value, hense vol is there!!!!

Limitations in Excel??? Limitations in your coding more like!!!!!! Just write the stuff in VB (the excel background) and you can write anything (if you want to get really tech then use a .dll and C++)

Enjoy
 
dewitte,

-define custom indicators
-use more than one securities’ data in one indicator (in this case reference the underlying stock’s last trade)
-use a securities’ (the option’s) BID and ASK in the indicator definition (instead of OHLC)

Question to Paul (Trader333): can Tradestation do all three?

I havent tried it and depending upon your datafeed, then Yes I think it can be done in Tradestation


Paul
 
Trader333 said:
dewitte,


I havent tried it and depending upon your datafeed, then Yes I think it can be done in Tradestation


Paul

Great news Paul, but are you sure about the third condition:

-use a securities’ (the option’s) BID and ASK in the indicator definition (instead of OHLC)
??

-dewitte
 
Robertral,

We have several discussions entangled here, which is fine, but let me focus on my request which concerns simple REAL-TIME BID/ASK IV CHARTS.

As an example here an attachment made after market close (a 5 sec. chart), importing an option’s bid & ask as if it were low & high (middle pane). These data together with the underlying’s “last” (upper pane) are all that is needed to calculate and plot both iv’s in the lower pane (plus of course strike, days and interest, set constant during one day).

In this case no iterations were used but a fast approximation that does a wonderful job of indicating relative iv levels (though again, it might even work with Newton-Raphson).

Trivial? Sure, no big deal. Too easy? Then why has none of the charting packages it included? (AFAIK. Does KOBRA/REUTERS? The iv --CHARTING-- that is)?

A simple algorithm in VB in excel? I stand proud: I am not familiar with VB. But help me along and write me such simple algorithm, possibly only for the lower pane but preferably for all three, nicely time-aligned as in attached chart. And working real-time of course. Then I'll tell you how to scalp your way to riches while the rest is focussing on Iron Condors!

-dewitte
 
Last edited:
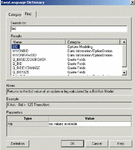
If you can display Bid and Ask (which TS allows based on datafeed used) then I know you can write code to do the rest. The attached screenshot shows that Easylanguage can be written to include Bid, Ask and Last price calculations.

I dont trade options so I am not sure how much more help I can give on this but I hope this helps.


Paul
 

Attachments

  • EL1.gif
    EL1.gif
    11.9 KB · Views: 453
Dewitte
"Getting the data in Excel is not a problem but how do I convert these constantly updating cells into a real-time chart? I guess this is primarily an Excel/VBA issue."

Another suggestion which might work.
In Sierra Charts, you can link to Excel.
So Excel could be performing the calcs and Sierra plotting the results.

Glenn
 
Glenn, I have been browsing the Sierra Chart documentation and I think indeed this can do it. I have an IB account so I will give it a try. Thanks for your help.

-dewitte
 
dewitte
You're welcome.

Sierra is a little quirky, as is it's documentation, but it does some clever things. You can rent it for a month for $12 in order to try it out.
You might be able to do the job with the Sierra speadsheet and not use Excel. Could be faster.
I have IB and Sierra, so might be able to help if you get bogged down.
Glenn
 
Corrections

Robert,

Thank you for pointing out the flaws ?????? – I should have made myself more clear. I should have said some in-the-money options trading at a discount. Near expiry??????? As an arb friend from a US bank pointed out to me, on 2 July (49 days expiry) a number of DAX August calls were at a discount!!!!!!!!.

I didn’t mention anything about otm, time value and no vol. I think intrinsic value and otm are mutually exclusive – there is no intrinsic value in otm options he he he he!!!!!!!!. Of course, there is intrinsic value and time value. My point was, without time value, implied cannot be calculated?!?!?!.

I also said a constant volatility is questionable – questionable because it isn’t constant across strikes/time. Where is the confusion???? I use the Black 76 model - or is it Black-Scholes 76!!!!!!!??????

Limitations in coding?????? I’d agree 100%. I could get ‘techie’, learn C++ or even become a Microsoft MVP and where Chinos!!!!!!!!

No thanks, I’ll stick with trading, drink, drugs and prostitutes!!!!!!!!.

Are you a quant, Robert???????? I reckon you are!!!!!!!!! If I need help, I’ll give you a shout!!!!!! One should never stop learning.Thank you, once again.

Grant
 
Top