Internals for the emini

stoploss please

Established member
Messages
780
Likes
10
Hi all

I am using the usual market internals to help me trade the emini.

These being the

SOX
XBD Broker Dealers
Tick
Trin
VIX

Are there any other internals which are worth looking at.
 
You van get strange readings on the TRIN occasionally because of Advancers vs Decliners being out of line with Up Volume vs Down Volume so it's better (imo) to watch the two separately, rather than combined via TRIN. Some people find value in cumulative versions of these as well. I've got some EFS studies that pull these together that you can have knocking about somewhere.

Some people also advocate using a cumulative TICK. I think it would depend on your trading style as to whether you found it useful or not. Again, if you want EFS studies for cumulative TICK, TICKI (and whattever the NQ equiv is) let me know and you can have 'em.

PREM (or EPREM A0 if you are still using e-Signal) used in combination with FV levels from programtrading.com or indexarb.com.

TICKI.

I know Mohan used to suggest watching MER as part of the high-5 setup but I've never seen the value myself. Doesn't mean it doesn't work for others though.
 
sandpiper said:
You van get strange readings on the TRIN occasionally because of Advancers vs Decliners being out of line with Up Volume vs Down Volume so it's better (imo) to watch the two separately, rather than combined via TRIN. Some people find value in cumulative versions of these as well. I've got some EFS studies that pull these together that you can have knocking about somewhere.

Some people also advocate using a cumulative TICK. I think it would depend on your trading style as to whether you found it useful or not. Again, if you want EFS studies for cumulative TICK, TICKI (and whattever the NQ equiv is) let me know and you can have 'em.

PREM (or EPREM A0 if you are still using e-Signal) used in combination with FV levels from programtrading.com or indexarb.com.

TICKI.

I know Mohan used to suggest watching MER as part of the high-5 setup but I've never seen the value myself. Doesn't mean it doesn't work for others though.


Hi Sandpiper

Interesting reading. You are right about the Trin, I find it is at times out of sync with the market. At those times I tend to ignore what it is doing. However, if it is in Sync, I gives me added confidence.

I am fairly happy with the standard charts Esignal give for Tick and Trin. I have a feeling if I start to use cumulative versions will only confuse me.

I experimented with the PREM, TICKI and TICKQ but they never gave me the results I wanted. However, it is the case that of the tools I initially discarded I am now using. This probably because with experience, I have a better understanding of these tools.

I am definitely going to look at the PREM again.

Thanks for the offer of the studies, I would much much appreciated if I can take a look.

Kind regards
A.
 
stoploss please said:
Interesting reading. You are right about the Trin, I find it is at times out of sync with the market. At those times I tend to ignore what it is doing. However, if it is in Sync, I gives me added confidence.
Not so sure that's a good thing to project your idea of 'sync' into the market or indicators. What do you mean 'in sync' or 'out of sync'?

TRIN provides a dynamic measure of volume and price action.

For example, if 3 issues decline on 100,000 shares and 6 issues advance on 200,000 shares, you're TRIN is going to give you a reading of 1.

If 30 issues decline on 50,000 shares and 60 issues advance on 100,000 shares TRIN is still going to give a reading of 1.

Although a TRIN value below 1 is considered Bullish and above 1 Bearish, it's more useful when considered in conjunction with, for instance, declining volume greater in proportion to decliners or increasing volume greater in proportion to decliners, and vice versa of course.

It's a useful little tool.
 
TheBramble said:
Not so sure that's a good thing to project your idea of 'sync' into the market or indicators. What do you mean 'in sync' or 'out of sync'?

TRIN provides a dynamic measure of volume and price action.

For example, if 3 issues decline on 100,000 shares and 6 issues advance on 200,000 shares, you're TRIN is going to give you a reading of 1.

If 30 issues decline on 50,000 shares and 60 issues advance on 100,000 shares TRIN is still going to give a reading of 1.

Although a TRIN value below 1 is considered Bullish and above 1 Bearish, it's more useful when considered in conjunction with, for instance, declining volume greater in proportion to decliners or increasing volume greater in proportion to decliners, and vice versa of course.

It's a useful little tool.

Bramble

The Trin was below 1 today and therefore bullish and the market did bounce off the gap.

However, I like to look at how the Trin is acting. I do not take it for granted that a reading below 1 is going to mean an up move. Upto 9.45EST on a 5 bar chart we had a rising Trin in a bullih zone. Ok, it is not exactly "out of sync", but it did not fit in with exactly what I wanted to see.

I understand where you are coming from it's just sometimes I find the Trin hard to read.
 
stoploss please said:
I understand where you are coming from it's just sometimes I find the Trin hard to read.
Too true it's hard to read. They (indicators) all are. You're attempting to differentiate something that's already been through at least one level of differentiation. Doesn't take too many passes through that process to fuddle things nicely.

I used to find it a useful additional tool until I realised just how much harder I was making it for myself using inds of any flavour.

The further you get from the real action (pure PVT) - the harder it is to make anything out.

Having said that, I'm not sure how much the process of attempting to successfully use TRIN (et al) was a necessary part of my trading education.
 
Last edited:
The further you get from the real action (pure PVT) - the harder it is to make anything out.

I am lookimg at price action before I look at the indicators but not sure if I will ever ditch the ones I am now using. I suppose when you start out understanding price is rather daunting. That is why most newbees look for a magic indicator to give them the answers.

I am happy with reading price but reading volume is a true skill and anyone who tells you otherwise is talking out of their bottom. Reading price and volume from end of day data when you are trading off daily charts is not too bad.

However, I must admit reading live volume off a 5 minute chart when the price is moving is a great deal harder. I recently viewed a recent seminar on IB concerning Price and Volume. The speaker just muddled through the seminar and made no real sense.
http://www.interactivebrokers.com/en/general/education/webinars/stocksComm-oct-2005.html

What I do find useful is following the price action on the Broker Dealers and Sox. The E mini will either follow or the other or as in todays case both.

Indicators, OBV and Stochastic but more as a heads up / confirmation tool and never as an entry trigger.

Ditched MAs ages ago. Use Parabolic SAR as a visual tool. Useful if you have a SAR on XBD or SOX before it happens on emini. Yet again not a trigger.

Attempting to be a Dark Sider but will probably end up a shade of grey.

By the way, where is the High priestess of the Dark Side, Skim these days. Not been very active on the board and notice she is no longer around.
 
stoploss please said:
By the way, where is the High priestess of the Dark Side, Skim these days. Not been very active on the board and notice she is no longer around.
She was indeed very generous and helpful. Seems she had enough of that and went off and did her own thing.

Maybe she woke up - or maybe even now needs to. Good luck to her.
 
Last edited:
@Sandpiper

With respect to the PREM, it does not matter what time scale you have the PREM on. All you are doing is looking at its current value against the numbers posted on Index Arb http://www.indexarb.com.

Just sounds a bit to simple to me. Is there more to it.

Kind regards
A
 
Probably a silly question

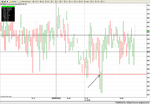
9.43EST, Prem hit its sell threshold. The ES rallied. Is that what is supposed to happen.
 

Attachments

  • ES 5min43.png
    ES 5min43.png
    64.3 KB · Views: 337
I think so stoploss. In theory ES is sufficiently cheap (below FV) to extract a quick profit so arbs buy ES and sell S&P basket of stocks simultaneously... then a few seconds later ES should fall back as the basket sale filters through and they start squaring positions. But it is doubtless more complex than that.
 
Thanks Frugi

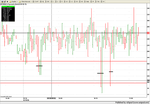
It has picked three of the turns in todays emini decline. Looks like a good little tool.
 

Attachments

  • ES 5min44.png
    ES 5min44.png
    57.8 KB · Views: 334
stoploss please said:
Probably a silly question

9.43EST, Prem hit its sell threshold. The ES rallied. Is that what is supposed to happen.

I've been doing a bit of forward testing on this & as far as I can see the opposite normally happens and it would therefore be a short opportunity. Obviously that one didn't work that way but the sell threshold has been hit 3 more times since then, with a fall (of various magnitudes)following each time.

Apparently using $Tick as a filter can help reduce bad trades (You want Tick to be falling for a short trade & rising for a long one) although that seems to be the case every time so far?!

Simon
 
Hi Turtle Trader

Compare the 1 minute Prem with the 1 minute ES of today. You will find it picked picked two Swing Lows and a large short bar just before the Swing Low. Are you saying that this is not normal?

As Frugi said, there is probably a lot more to it.
 

Attachments

  • ES 5min45.png
    ES 5min45.png
    106.8 KB · Views: 337
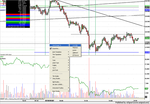
An observation with todays Prem. We had three threshold readings and then a reversal. Ok the reversal came off a strong strong trend line.

Is it a case of all good things happen in threes. ie Three low Prem readings and a reverse.

As I have not used it just wondering if this is just a coincidence. I have read what fair value is and still not sure if this type of programme trading will have a minor or major effect to the trend in place.

I suppose the more it happens in one direction, the quicker the trend will lose its momentum

http://www.programtrading.com/fvalue.htm
 

Attachments

  • ES 5min46.png
    ES 5min46.png
    140.7 KB · Views: 296
stoploss please said:
Probably a silly question

9.43EST, Prem hit its sell threshold. The ES rallied. Is that what is supposed to happen.

The mechanics of the buy/sell levels are exactly as Frugi described.

As for the setup... I use a 1 tick chart of EPREM A0. The only difference between this and $EPREM being that EPREM A0 updates with every tick of the ES and then every six seconds to reflect the value of SPX.X, whereas $EPREM updates every 6 seconds only.

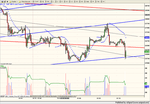
I use a chart as attached (this one shows the IndexArb levels). I use zones rather than the lines that you have simply because of the tick soze of ES, i.e. 0.25. So, on my chart, the Fair Value 'zone' is set to 2.61 +/- 0.24. Above FV + 0.24 and ES is trading above fair value. Below ES - 0.24 and ES is trading below fair value. I show the buy and sell levels with the same 'zone buffers'.

The buy and sell levels do work, although, as you can see from what happened after your post, once stops get hit on the downside, it can take a while to react.

I would say that the buy and sell levels are probably the least used aspect of PREM (other than by the index arb programs obviously). The simplest and probably most common use, is that of a filter. Example, if you want to short, don't until ES is trading at greater than fair value. Likewise, if you want to go long, don't unless ES is trading below fair value. There are of course lots of other aspects to prem. I suspect there might be some posts around by frugi and mr. marcus discussing it.
 

Attachments

  • EPREMA0.png
    EPREMA0.png
    30.9 KB · Views: 295
Cheers Sandpiper. It's begining to make a lot more sense. There are some good simple rules you can easily apply to your trading using the Prem.

Btw, nice chart. Looks like a Basset Allsort. Is that from Esignal.

On the subject of Esignal, it does not seem to like the symbol $EPrem A0. Are you using Esignal. I will have to give them a call I suppose.
 
stoploss please said:
Cheers Sandpiper. It's begining to make a lot more sense. There are some good simple rules you can easily apply to your trading using the Prem.

Btw, nice chart. Looks like a Basset Allsort. Is that from Esignal.

On the subject of Esignal, it does not seem to like the symbol $EPrem A0. Are you using Esignal. I will have to give them a call I suppose.

No $ in the symbol. Just EPREM A0. They have set it up like a futures contract.

Yes. I am using Esignal.

Here's the study if you want it. You'll have to change it from a .txt file to a .efs (couldn't upload the .efs suffix).
 

Attachments

  • PREM (IA-Levels).txt
    2.7 KB · Views: 369
Stoploss,

I just noticed he's hanging around, so if you are lucky mr. m may give you more of a heads up.
 
Top