You are using an out of date browser. It may not display this or other websites correctly.
You should upgrade or use an alternative browser.
You should upgrade or use an alternative browser.
- Messages
- 549
- Likes
- 2
nice chart Riz.
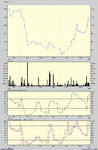
It looks like the MFI has formed a bottom and we just need one last push to move up to 110p followed by 120p then 145p.
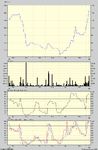
By the way, just seen your ENO chart. Those gaps are amazing!
It looks like the MFI has formed a bottom and we just need one last push to move up to 110p followed by 120p then 145p.
By the way, just seen your ENO chart. Those gaps are amazing!
cheers darth,
It did carry on with the uptrend..+2.5 (2.5%) 104.5..
darth, we've got so many interesting bottom shapings out there...remember all those head&shouders, double tops forming day in day out during the TMT crash...now slowly but constantly it's time for the other way round...cup&handles, double bottoms, u-shape bottoms, saucers, morning stars (that's your department), etc...we really have to work harder and work them out to make the best out of them...shame the board got quiet just when it should be most active, apart from a few of us of course...so let's keep working on those nice shapes 🙂
I'll update the chart to follow the progress on this one...
Riz
- Messages
- 549
- Likes
- 2
Agreed Riz.
There seems to be a bull market within certain sectors of the small caps and fledglings. Funnily enough lots of the companies doing well now fell to earth when the tech's ruled the world! (eg. CC.)
I seem to find cups/saucers wherever I look. Otherwise there are all time highs a plenty.
Check out GBN, DLAR and HOF. I hold them all but there are too many other candidates to mention...
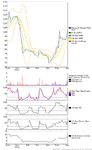
I agree Darth. Lots of interesting chart shapes around. My favourite two are positive divergence on bottoms, and Bull Wedges.I'm also investigating volatility breakouts. I've got my eye on CHLD at the moment...Hopefully it will come right just as I exit BAY and along with SOF, these are two Bull wedges that have delivered the goods to perfection.
- Messages
- 2,325
- Likes
- 17
What exactly is a bull wedge? Is it a falling wedge, going against the trend?