indicators that work

Mr Steve

Junior member
Messages
35
Likes
0
I just recently lost a lot of money on the symbol “ICE and BIDU” playing options.
I know a lot of indicators are lagers, but being new to getting in and out of the market I pay attention to Candlesticks and volume. Are there any good indicator settings for MACD or others indicators that could help.
And what are the best indicators and settings to use in swing and day trading.
I also pay attention to 15 and 30 and 240 minute charts. Is there any good silver bullets.

Thank you
Mr. Steve
 
I know a lot of indicators are lagers.

Personally I don't drink and trade.

Is there any good silver bullets.

I thought Silver bullets were used to kill vampires and werewolves.

Seriously, trading options can be seriously bad for you and if you are having to be asking the above questions you may be better off trading something else.
 
Personally I don't drink and trade.

A lethal combination.

I usually breathalyse myself just before the market opens and if the crystals change colour I do not trade.

I just go to the pub and get even more p1ssed.
 
Just an idea but you might want to get good at paper trading before you risk any more money.
I learned that lesson the hard way myself. I don't use indicators now but when I did I LOVED the MACD. Divergence was what I looked for when using it. That is the only way I know of to use it to forecast. Every other way I know of to use it lags the market.
 
IBM.gif
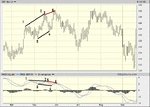
Notice that the price and MACD are not doing the same thing. From pivot "1" to pivot "2" on the price chart the price gave a higher high, but "1" and "2" on the MACD was lower. That's what I mean by divergence.
When that happens the MACD is letting you know the price will most likely change direction.
Again notice that pivot "3" and "4" were higher bottoms on price but not on the MACD. This again let you know that price was most likely going to change direction.
The same with "5" and "6".
If you look at the price chart it happens again in September. If you look at the bigger swings over months you can see it again.

Hope this helps some.
 
Last edited:
View attachment 40240
Notice that the price and MACD are not doing the same thing. From pivot "1" to pivot "2" on the price chart the price gave a higher high, but "1" and "2" on the MACD was lower. That's what I mean by divergence.
When that happens the MACD is letting you know the price will most likely change direction.
Again notice that pivot "3" and "4" were higher bottoms on price but not on the MACD. This again let you know that price was most likely going to change direction.
The same with "5" and "6".
If you look at the price chart it happens again in September. If you look at the bigger swings over months you can see it again.

Hope this helps some.

The trouble with divergence is that it can appear much earlier than the reversal. Take the graph above, divergence appears on the peak before those numbers, if you shorted here, you would likely get stopped out. How do you know at what peak divergence will actually result in a reversal?
 
You have to watch price action.
i.e. In an uptrend start by looking for a new higher high in price but not MACD. After that look for reversal bars or candles. Also trendlines can help. Wait for price to break below the low of the last bar/candle. You can't use divergence as a stand alone signal and jump in as soon as you see it. You use it as an indication that price is getting ready to reverse. After that you have to watch the price.

Also notice I said that I don't use indicators any more. I believe that price will give all the information you need.
Some people are looking for something that tells them what to do and they believe that indicators will do that.
 
The more serious answers above were very useful, welcomed and I think all contributors for bringing attention to some of the things I have been overlooking. I have been using price and volume so much I have been overlooking the MACD divergence. Thanks for bringing it to my attention. Any other advice is very welcomed.
Mr. Steve
 
My only other advice at this time is if you choose to use indicators in trading never use more than two. That does not include moving averages. I wish you the best in all that you trade.
 
I just recently lost a lot of money on the symbol “ICE and BIDU” playing options.
I know a lot of indicators are lagers, but being new to getting in and out of the market I pay attention to Candlesticks and volume. Are there any good indicator settings for MACD or others indicators that could help.
And what are the best indicators and settings to use in swing and day trading.
I also pay attention to 15 and 30 and 240 minute charts. Is there any good silver bullets.

Thank you
Mr. Steve
Hi Steve use alligator and study it carefully.Alligator is very effective , it will eat all the bull and the bear easily mony making .If you use MACD try to use the divergence to indicate a reversal pattern. Its not always accurate but It will help you gauge when to enter and exit the market. My final advice is study the chart pattern as leading indicator.
Good luck
 
Good advice hwsteele. Best to keep a trading system simple so that you don't tie yourself up in 'what-ifs?' when the real money goes in.

But in addition, one reason why many folks pile up a bank of indicators is that they think ther accuracy will compound. That is, if you have an indicator that is 70% accurate in signalling trades, then 30 out of 100 trades will be losers: some think that if you add a second indicator that is also 70% reliable, you would knock out 70% of the losers, so you end up with an overall success rate of 91%. Adding further indicators, by this logic, increases the win rate to a fantastic degree. This is all notionally true, so its a very seductive process, but in practice it is nonsense.
 
I believe you are correct about why people use allot of indicators. They think their odds will go up. Funny thing is it only hurts them. You go from the 70% back down to 50% really fast and sometimes lower! IMHO people would be better off trading without indicators.

But hey that's just me!:cheesy:
 
The more serious answers above were very useful, welcomed and I think all contributors for bringing attention to some of the things I have been overlooking. I have been using price and volume so much I have been overlooking the MACD divergence. Thanks for bringing it to my attention. Any other advice is very welcomed.
Mr. Steve

hihihi...i've found that indicators & oscillators are best used in the context of the bigger trend. indicators work best when u start by firstly checking out the trend on longer term charts (ie start with looking for direction of trend using an EMA on a half-hourly chart if the chart u like to trade is a 5 or 10min chart). from here, u only look for trades in the direction of the trend using an indicator (such as MACD) on your shorter term chart (5 or 10 min chart). i learned this principle from a book by Alexander Elder called Trading for a Living (book obviously give alot more detail). quite straight fwd, but helps identify good risk/reward trades!(y)
 
Good advice hwsteele. Best to keep a trading system simple so that you don't tie yourself up in 'what-ifs?' when the real money goes in.

But in addition, one reason why many folks pile up a bank of indicators is that they think ther accuracy will compound. That is, if you have an indicator that is 70% accurate in signalling trades, then 30 out of 100 trades will be losers: some think that if you add a second indicator that is also 70% reliable, you would knock out 70% of the losers, so you end up with an overall success rate of 91%. Adding further indicators, by this logic, increases the win rate to a fantastic degree. This is all notionally true, so its a very seductive process, but in practice it is nonsense.

Not quite sure on some points raised on this..some indicators can be used to confirm
another indicator therefore using a "positive compounding" effect. what should be used
are indicators that confirm or deny different aspects. having an overload is however a
real possibility, so should be avoided at all costs. but looking at one indicator for the
sole purpose of it confirming (or denying) a second indicator and nothing else is a positive
strategy which I use all the time. This is not an overload, just good trade management
 

Attachments

  • untitled.JPG
    untitled.JPG
    151.4 KB · Views: 600
Hi mechtraderpro -

I think the reason a lot of people don't get this is becasue it is wrong in such a simple way.

Fact - if indicator A gives 70% success rate, for every 100 trades, I will have 70 winners and 30 losers.
Theory - if I use indicator B and this also has a 70% success rate, it will reduce the 30 losers by 70% to 21. 21 + 70 = 91, so my overall success rate is now 91%. Fantastic!

In fact, this is wrong. Using indicator A gives 70 winners out of every 100 but indicator B has to be used simultaneously on all trades, not just the losers, so the overall success rate using A and B will be better than just using A or B alone, but not that good. And the benefit of adding multiple indicators becomes negligible. The more serious downside is that traders become confused with multiple indicators, some of which are going to contradict each other at times, and some of them are event re-iterations of the same evidence in different expressions.

Hi Tomorton.
Fully agree with your reckoning, and understand what you say. (y) It is just a difference of trading technique, what I was really saying is that people should use different ways in which to trade. find a suitable vehicle in doing so (either single OR multiple indicators) as long as it works for them and build on that to improve. If that means multiple choice of indicators that "gell " and you fully understand that vehicle then thats ok. I do not believe that "traders" should follow one or the other just because they have been told thats whats what is expected of them ...what i'm looking for is the inventiveness of the individual. if there is no inventiveness then we cannot move forward and we may as well be "sheep"( either rich or poor ). There should always be room for "new " ways of doing things....not of course dismissing the "old "on the way past. Even experienced successful traders should look at other methods of improvements and never allow themselves to think " well thats as good as I can make it" and give up....therefore if multiple or single indicators work. so be it (y)
 
Hi mechtraderpro -

I think the reason a lot of people don't get this is becasue it is wrong in such a simple way.

Fact - if indicator A gives 70% success rate, for every 100 trades, I will have 70 winners and 30 losers.
Theory - if I use indicator B and this also has a 70% success rate, it will reduce the 30 losers by 70% to 21. 21 + 70 = 91, so my overall success rate is now 91%. Fantastic!

In fact, this is wrong. Using indicator A gives 70 winners out of every 100 but indicator B has to be used simultaneously on all trades, not just the losers, so the overall success rate using A and B will be better than just using A or B alone, but not that good. And the benefit of adding multiple indicators becomes negligible. The more serious downside is that traders become confused with multiple indicators, some of which are going to contradict each other at times, and some of them are event re-iterations of the same evidence in different expressions.

Exactly. Treating in terms of probability of success:

Using two indicators with probability of 70% accuracy each will result in probability of 49% accuracy when used together and so on.... ( 0.7 x 0.7 x .......)

VG
 
Top