In at the birth

barjon

Legendary member
Messages
10,752
Likes
1,863
....and out at the death

Fully fledged trends are easy to spot in hindsight, as are completed ones. In at the birth and out at the death is the ideal, but probably only something Mystic Meg can aspire towards. For most of us the birth requires some confirmation, maybe whilst the little blighter is still in shorts pants at primary school, or in longs at secondary school, or on graduation from college, or when? 'Course if you require so much confirmation that you are only convinced as he draws his pension then the fatal heart attack is not long coming.

So, is anyone up for exploring the anatomy of a trend? Let's start with the birth, or near to, if you are.

good trading

jon
 
Birth of a trend.

....and out at the death

Fully fledged trends are easy to spot in hindsight, as are completed ones. In at the birth and out at the death is the ideal, but probably only something Mystic Meg can aspire towards. For most of us the birth requires some confirmation, maybe whilst the little blighter is still in shorts pants at primary school, or in longs at secondary school, or on graduation from college, or when? 'Course if you require so much confirmation that you are only convinced as he draws his pension then the fatal heart attack is not long coming.

So, is anyone up for exploring the anatomy of a trend? Let's start with the birth, or near to, if you are.

good trading

jon


For me the birth of a trend starts on my intermediate time frame and then if that trend develops it extends to the higher - trend t/f, (and possibly beyond.) I use overall price action-peak/valley analysis to determine whether a trend is/may be present and the minimum qualifications for a trend are as follows;

Up trend - a L or LL followed by a H or HH followed by a HL
Downtrend - a H or HH followed by a L or LL followed by a LH.

If at the HL (uptrend) or LH (downtrend) there is pre-identified potential rbs/sbr repectively and the macd signal line is crossed up/down respectively on my intermediate t/f (where the trend is develioping) and at least pointing up/down on the higher trend t/f when price tests the potential sbr/rbs after a pullback, this is the earliest point at which I would ordinarilly consider entering an intermediate t/f trend via the lower trigger t/f. If the trend is good then it will begin to extend to the higher trend t/f per peak/valley analysis, and of course I keep appraised of whether this developing trend is with or contra any that is present on the time frames immediately above my highest trend t/f.

Of course there are times when a trend can start with a violent move perhaps initiated by the market's reaction to data or an event and this may not match the minumum qualifications per peak/valley analysis decsribed above but may still be worth considering getting involved with via momentum techniques or at the first pullback as decsribed above.
 
the beginging of a trend? hmm when the markets were first created! every trend is a trend with in a trend..imo
 
When the price starts going up/down, and stops when the price stops going up/down imho
 
If the birth of the recent uptend was 10/03, what was special about 09/03?

On 09/03, 20RSI sank to 21.052, its lowest level for over 2 years.

From my Sharescope charts back to January 1994, this indicator has only been lower than that during 4 other episodes in 15 years - 1 day in May 2006, 3 in January 2003, 2 in June 2002, and 8 in September-October 1994.

Clearly, a significant point had been reached.
 
While the Coppock, inherently slow as ever, turned upwards from a negative score on 30/04, just the 4th time in 15+ years.
 
If the birth of the recent uptend was 10/03, what was special about 09/03?

On 09/03, 20RSI sank to 21.052, its lowest level for over 2 years.

From my Sharescope charts back to January 1994, this indicator has only been lower than that during 4 other episodes in 15 years - 1 day in May 2006, 3 in January 2003, 2 in June 2002, and 8 in September-October 1994.

Clearly, a significant point had been reached.

What happened on those other occasions when the indicator reached this level?
 
So, is anyone up for exploring the anatomy of a trend? Let's start with the birth, or near to, if you are.

good trading

jon
It sounds like you're looking for two bits of information then......

1) the first touch point of a TL in realtime and

2) its gradient

Is that right ?

Anyway, isn't out at the death easier than in at the birth ?

dd
 
Last edited:
....and out at the death

Fully fledged trends are easy to spot in hindsight, as are completed ones. In at the birth and out at the death is the ideal, but probably only something Mystic Meg can aspire towards. For most of us the birth requires some confirmation, maybe whilst the little blighter is still in shorts pants at primary school, or in longs at secondary school, or on graduation from college, or when? 'Course if you require so much confirmation that you are only convinced as he draws his pension then the fatal heart attack is not long coming.

So, is anyone up for exploring the anatomy of a trend? Let's start with the birth, or near to, if you are.

good trading

jon

Jon

First it is necessary to determine the timeframe in which you are evaluating the trend. A trend on one timeframe may simply be part of a consolidation pattern on a different timeframe.

Second we should look at the characteristics of a trending market. You have the usual ones of a series of higher highs, higher lows, lower highs and lower lows. Other signs might be the behaviour of moving averages compared to price, support and resistance levels perhaps being broken.

but perhaps more importantly

Third we should look at the characteristics of a non-trendng market - one that is flat or exhibiting consolidation behaviour within the timeframe under consideration. If price is exhibiting the characteristics of a non-trending market within the timeframe being considered then it cannot at the same time be trending within that timeframe. For example, does price oscillate between zones of support/resistance.

Fourth we might look at acceleration/deceleration of price change. As the end of a trend is approached we might expect a different balance between buyers and sellers to emerge that will manifest itself in different spreads, different volatility and changes in volumes traded. It is often useful to observe this in real-time because you really get a feel for the changes happening.

Charlton
 
jon, you look positively naked without your blue garb....

Interesting thoughts. A trend fairly obviously starts at the tick level, but when YOU get to recognise it as such depends on which TFs you're working with.

Take AUDJPY.

In the Monthly it’s certainly pushing up over the last 5 months, but what’s YOU’RE definition of a trend – at least two higher highs and higher lows (or the reverse for down trends in all that follows in this post) or just two or three bars with higher highs and higher lows? If the former, the monthly is still undetermined, in the latter it’s an up trend.

The Weekly qualifies as an uptrend by anyone’s definition.

Daily is still hanging in as an uptrend.

In fact, anything down to the hourly shows it to be in an uptrend.

But as soon as you slip below the hourly, as I write (09:45 CET) it’s most definitely in a down trend.

So which is it?

Depends entirely on your trading TF.

And getting back to jon’s OP, when did the trend start? Well, easy, as he says in retrospect, but even then we have to ask ourselves, in which TF?

This has all the makings of a good thread. Nice one jon.
 
Apologis to Charlton. He ahs already highlighted the TF issue above.


note to brain: read ALL posts in thread before responding...
 
If you trade reversals, you can avoid completely having to ask all these difficult questions about whether the trend has started or not and whether it's in kindergarten, secondary school or higher education. The market will tell you all of these things in the fulness of time, regardless of whether time to you means 5 minutes because you trade a tick chart or days because you trade a daily chart. Identifying market reversals will, by definition, get you in soon after the birth of a trend - no matter how short lived - and out soon after its death. Identifying reversals IS the holy grail of trend trading, IMO.
Tim.
 
timsk - I think that's what jon is asking. How do YOU know it's a reversal (i.e. the start of a new trend) rather than just a minor rally/correction to the exisiting trend.
 
If you trade reversals, you can avoid completely having to ask all these difficult questions about whether the trend has started or not and whether it's in kindergarten, secondary school or higher education. The market will tell you all of these things in the fulness of time, regardless of whether time to you means 5 minutes because you trade a tick chart or days because you trade a daily chart. Identifying market reversals will, by definition, get you in soon after the birth of a trend - no matter how short lived - and out soon after its death. Identifying reversals IS the holy grail of trend trading, IMO.
Tim.

I like trading reversals but I still pay attention to the trend. I would MUCH rather trade a reversal with the trend than against it because I am stacking the probabilities in my favour.

Eg. daily pinbar on 21st April on UsdCad with the trend - I am happy to take that without hesitation.

A counter trend daily pinbar formed on UsdCad yesterday. I won't take this one unless I see some form of extended consolidation or double/triple bottom to negate the selling momentum. If it takes off without me then so be it.
 
timsk - I think that's what jon is asking. How do YOU know it's a reversal (i.e. the start of a new trend) rather than just a minor rally/correction to the exisiting trend.
Hi Tony,
As you well know, one can't know - as in really know - sadly that's not possible! All anyone can do is trade probabilities based on chart patterns, phases of the moon - whatever. Perhaps I misunderstood Jon's OP, but many people wait for confirmation signals that a trend is underway before jumping on board. Jon's point - or so I thought - is that if you do that, you risk joining the trend too late and missing out on a part of it or, even, the bulk of it. An obvious example is basic Dow theory characterized by a H&S pattern. Even novices these days would think twice about entering at the breach of the 'neckline' which is what TA books of old would have us all do. My point is that trading reversals will get you in as near to the birth and out soon after the death of the trend as possible. Put it this way, I've never encountered any ideas or techniques that capture more of a trend than reversals do. If Jon wants to steer the thread towards discussing reversals, then I'll gladly contribute. But that''s not the purpose of the thread as I understand it, which is about trends rather than about reversals.
Tim.
 
Hi Rags,
Any chance of a chart or two to illustrate your points please? The problem with threads like this is that there are no hard and fast definitions by which we all abide. Therefore, one traders trend is another traders pull back etc.
Cheers,
Tim.
 
Timsk, you're of course right. It is impossible to know and all you can do is trade probabilities, but perhaps there are some indications from price action on the chart, that don't ensure the start of a new trend, but make the probability of one higher. And if we can identify some of those, then that would be extremely useful.

If you look at the Dow, and it was in a downtrend, and the start of the recent uptrend was March 6th - March 10th. I can see a few 'interesting' things on the chart within that time frame. I'm not experienced enough to know if those are standard signs of a reversal, but hopefully this thread will enlighten me some more :)
 
usdcad illustration

here u go
 

Attachments

  • Spot FX USD_CAD (02-JUN-09).png
    Spot FX USD_CAD (02-JUN-09).png
    32.6 KB · Views: 218
There are reversals against immediate price action but with the trend on next t/f [+] ie a pullback to potential sbr/rbs on that t/f or reversals against trend period.

How do we know which is which, simple answer-we don't but we can make intelligent assumptions based on historical price action.

a. Markets trend, we assume they wil continue to do so and in a trend there are pullbacks.

Further,

b. Market participants look to sell rallies/buy dips after a pullback as a way of more cheaply entering a prevailing trend.
c. Trends have characters and statistics including whether it's pullbacks are shallow or deep.
d. Market participants trade contra-trend at areas of potential supp/res (generally!) and it is possible to guauge the potential strngth of these areas.
e. How many time frames above your trigger t/f exhibit a reversal set-up, or go on to form a reversal candle can give us an indication of the potential for a reversal -vs- in character pullback -vs- deeper pullback/correction.
f. Market sentiment may change quickly (counter trend) on the release of sata/news, and the strength of that reaction can give clues to the chances of a prevailing trend continuing or revesing on the data.
g. After a reversal candle it is down to price action on your smallest t/f first then going up through the time frames as to whether the reversal is a pullback or a complete reversal in the trend. If price reaches an area of sbr/rbs then you can judge the likley chances of the trend continuing from there and reversing the immediate contra-trend/pullback direction buy the price action on your lowest time frames (ie peak/valley analysis.)

G/L
 
Last edited:
Good stuff guys :)

My take is that trends start either as a reversal of the current trend or from a breakout when price has been rangebound.

Let's take it slow and start off in the delivery room and labour pains (it's a man's world alright!!).

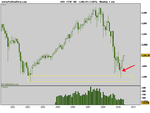
Reversals - the only single potential reversal candles I have found reasonably reliable are the hammer (shooting star) types, particularly when associated with previous support (resistance) zones. See example below (Oh My God! It's a pinbar, I'm in the wrong thread :eek:). I think it's worth making the assumption that a new trend just might be being born here and at least a tester position entered.

Others so-called reversal candles such as engulfing, dark cloud cover, piercing etc I've always found pretty useless.

Slightly off-topic I will always double up my position in my bread and butter 3 bar swing trading when the swing low (high) bar is a hammer (shooting star) since there is a near 80% chance of the desired direction being achieved (not necessarily resulting in successful trades).

breakouts - I suppose the breakout bar is the single event. Many are false but probably worth at least a tester since when you do catch one it often rockets off without any pullback to speak of.

So , for me, they are the things that light the first potential new trend light at the birth stage. Several other lights need to light up to confirm a new trend, of course, but that comes later.

good trading

jon
 

Attachments

  • FTSE 100 birth.png
    FTSE 100 birth.png
    8.8 KB · Views: 187
Top