WolverineHK
Junior member
- Messages
- 23
- Likes
- 0
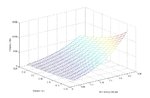
Guys, could you please show me the implication of the 3D diagram attached in the post? I have difficulties in understanding 3 dimensional diagram. What I got from the picture at the moment is the company value is more sensitive to short term growth rate rather than discount rate, I couldn't get any else. Especially I can't understand the surface, and those color implies what? So please help! =)
thank in advance.
All the best,
Kenneth
thank in advance.
All the best,
Kenneth