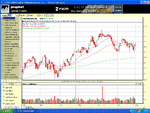
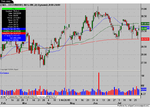
Here's why I am closing position. http://www.800bull.com/Chart.htm
You are using an out of date browser. It may not display this or other websites correctly.
You should upgrade or use an alternative browser.
You should upgrade or use an alternative browser.
Hi sun123 it is all explained and logged clearly on my website please take the time to have a look around it before making judgements.
I have a small interactive brokers account which is currently getting larger.
No new trades today but my performance has been updated. Here is the link http://www.800bull.com/performance july05.htm
I have a small interactive brokers account which is currently getting larger.
No new trades today but my performance has been updated. Here is the link http://www.800bull.com/performance july05.htm
No new trades today but my performance has been updated. Here is the link http://www.800bull.com/performance july05.htm[/QUOTE]
My apology
My apology
Selling to close position in PPHM http://www.800bull.com/Chart.htm
Buying on today's open SYBR http://www.800bull.com/Chart2.htm
Buying on today's open SYBR http://www.800bull.com/Chart2.htm
No new trade's today.
PPHM closed, Performance updated http://www.800bull.com/performance july05.htm
PPHM closed, Performance updated http://www.800bull.com/performance july05.htm
wwatson1 said:
Hi, Is there an explanation for the following, I brought up the TMA chart on
Prophet charts....... 6month/daily with a 200sma/ ema, the price is no where
near the moving average. I have noticed this occuring with other charts.?? 😢
I have alway's used bigcharts so am not sure about prophet, here is the link with the 200sma plotted on the daily chart which shows a clear bounce of the average.
http://bigcharts.marketwatch.com/quickchart/quickchart.asp?symb=tma&sid=0&o_symb=tma&freq=1&time=8
I can't explain why they are different, can enyone else shed some light on this??
http://bigcharts.marketwatch.com/quickchart/quickchart.asp?symb=tma&sid=0&o_symb=tma&freq=1&time=8
I can't explain why they are different, can enyone else shed some light on this??
roguetrader
Senior member
- Messages
- 2,062
- Likes
- 49
The positioning of a given MA will vary depending on how the MA has been calculated, whether it is on open, or close or some other combination to take into account the or if it is weighted etc.
Both the 200 sma and ema are close to this stock with the ema closest. That is calculated on close. I would go as far as to suggest that most default settings should be fairly close, can you post a chart Eddyjo?
Both the 200 sma and ema are close to this stock with the ema closest. That is calculated on close. I would go as far as to suggest that most default settings should be fairly close, can you post a chart Eddyjo?
I you click this link http://www.800bull.com/Chart.htm this was my trade for friday, The yellow line is the 200sma.
roguetrader
Senior member
- Messages
- 2,062
- Likes
- 49
Hi wwatson, yes I am aware of your chart and see no problem with the MA it is the same for my charts, just trying to see if I can assist eddyjo as to why his is so differentwwatson1 said:I you click this link http://www.800bull.com/Chart.htm this was my trade for friday, The yellow line is the 200sma.
roguetrader
Senior member
- Messages
- 2,062
- Likes
- 49
Hi Eddyjo, you need to save the chart from that program in a compatible format such as .BMP, or .JPG or .GIF then from the advanced message click on "manage attachments" and locate the file where you have saved it and upload.eddyjo said:Hi, I have the chart in the paint box how do Itransfer to T2W?
roguetrader
Senior member
- Messages
- 2,062
- Likes
- 49
Ok,not sure what you mean here otherwise there wouldn't be a what next?
At the bottom of this page where you may normally be replying click "Go Advanced", on the page that appears you will see a button "Manage Attachments" click on it and a box will appear select browse in the box and locate the file owhere you have saved it and select it, then click "Upload". When it has finished close this small popup window and submit the message.
At the bottom of this page where you may normally be replying click "Go Advanced", on the page that appears you will see a button "Manage Attachments" click on it and a box will appear select browse in the box and locate the file owhere you have saved it and select it, then click "Upload". When it has finished close this small popup window and submit the message.
Attachments
roguetrader
Senior member
- Messages
- 2,062
- Likes
- 49
Ok I see what you mean, give me a few minutes to see if I can recreate the position of the MA on my charts, as I don't immediately see why it is printing there.
That is rather odd, I cannot see why your chart is so different and I cannot recreate the 200 sma in that location on my charts. I do however note that where you have your cursor line on your chart, 26th April 05 the closing price is listed as $29.104, my closing price for the same day was $29.78, that is a rather large discrepancy, there are often discrepancies between providers but not normally that large.. Since SMA's are usually default calculated off the closing price it would not require too many of those to offset the line.
That is rather odd, I cannot see why your chart is so different and I cannot recreate the 200 sma in that location on my charts. I do however note that where you have your cursor line on your chart, 26th April 05 the closing price is listed as $29.104, my closing price for the same day was $29.78, that is a rather large discrepancy, there are often discrepancies between providers but not normally that large.. Since SMA's are usually default calculated off the closing price it would not require too many of those to offset the line.
Attachments
Last edited:
roguetrader
Senior member
- Messages
- 2,062
- Likes
- 49
I also notice on my chart ther is a large gap down moving from April into May, I do not see that on your chart. The disparity I believe is being caused by different closing prices by your provider, why these exist or who is right I cannot say but that is why you MA's are in different places.
Hi Watson,
I just came upon this thread and find it very interesting. I have been using a similar swing method utilizing Ramp software from www.nebadawn.com. The software filters out stocks that are trending up and have touched and utilized the trendline as support at least 3 times. The trendline acts as support much as the 200 m/a which can also be placed onto the Ramp charts. I do use other criteria such as fib scans on Ramp before settling on my final stock choices. I do also look for downward trending stocks if the overall market is downtrending however. I have tried to post a chart but failed to upload it from the "Manage attachments dialogue box" to this posting area. I must admit to being a dunce when it comes to this sort of thing so any help will be appreciated. Thanks.
I just came upon this thread and find it very interesting. I have been using a similar swing method utilizing Ramp software from www.nebadawn.com. The software filters out stocks that are trending up and have touched and utilized the trendline as support at least 3 times. The trendline acts as support much as the 200 m/a which can also be placed onto the Ramp charts. I do use other criteria such as fib scans on Ramp before settling on my final stock choices. I do also look for downward trending stocks if the overall market is downtrending however. I have tried to post a chart but failed to upload it from the "Manage attachments dialogue box" to this posting area. I must admit to being a dunce when it comes to this sort of thing so any help will be appreciated. Thanks.
Similar threads
- Replies
- 0
- Views
- 1K


