Ideas for increasing trader performance

Status
Not open for further replies.
When I get some time I will put up some ideas for playing failed breaks/patterns as these can be very profitable.

If someone can remind me next week I'll do that - pretty busy today.

Tom

Don't know how much time you've got this week to jot something down, Tom, but I for one am looking forward to hear your ideas re: failed breaks/patterns.

Cheers,
Boy
 
What's on the agenda for tomorrow? Quite a lot but I will post only one because I have been working all day and I am off to watch the rest of 24 which I am getting steadily hooked on.

EUR/GBP

Taking a top down approach, the market has found significant resistance up at 0.9026 and formed a bearish engulfing on the daily time frame. The next big daily level is quite a way lower at 0.8839. This pair loves to range so I think it has a decent chance of making it down here.

Let's come onto the hourly. There are four levels on my charts between where we are now and the big daily target. That's a good opportunity to divide the total position size into four and scale 1/4 out at each. As each 1/4 comes out, we can run a trailing stop on the rest.

So where to get in? Well it's a bearish engulfing and these usually suffer some retracement. I'll look to sell 0.8968 which is the first hourly s/r pivot with a stop above the last swing high at 0.8984 (which also give you cover provided by the 38 fib ret). That gives you a stop of approx 16 pips (+ spread) and it's 43 (- spread) to your first target.


Belatedly Tom, I have to take my hat off to you on this trade.

Privately at the time, I didn't think it was going to go anywhere near as low as you were saying, and certainly not as low as it subsequently went.

Did you follow it down below 0.8839 and beyond?

I'm actually now wondering if it's destined for 0.8600...

Reminds me of one of your old .sigs (I think) that said something like "your chart has a floor and a ceiling, but the price or the market doesn't ..."
 
Here's an interesting article I found on the interweb, which discusses support and resistance. Definitely worthwhile reading, especially for noobies.:smart:

link
 
I've saved the template of my chart for the EUR/USD as it currently looks.

I've never thought of this before but this must be the easiest way to convey my market map to you.

Download the attachment in this message and save it to your desktop. (You can virus check it first if you feel the need)...

For those of you who now want to strip candles from their repertoire so they are just left with a blank chart (horizontal lines are optional - the eye can pick them out without drawing them) - go back to the post I have quoted and overlay your Euro chart with that template.

And you will see why I will always have a smirk on my face when someone says that you can't use technical analysis to get an edge in the market and make money.

For this is what I call techical analysis in its purest form.

Not head and shoulders patterns or cup and saucer patterns.

Not lots of moving averages and indicators making your charts look like spaghetti junction.

As my hero Spanish89 once said, you only need a horizontal line to make money. (I would also add some screen time and some common sense) :)
 
I'm actually now wondering if it's destined for 0.8600...

0.8602 to be precise :)

I don't know how much you look at the bund mate but I've been buying it for the last few days up here and keep adding to it.

It looks to me like it's going to go ballistic any day now.
 

Attachments

  • bund.gif
    bund.gif
    18.5 KB · Views: 533
Last edited:
0.8602 to be precise :)

Feather plucker :)

Someone was forecasting it might get down to 0.85 - not sure on what grounds though.
Seems to be more or less on its way back up though.

I don't know how much you look at the bund mate but I've been buying it for the last few days up here and keep adding to it.

It looks to me like it's going to go ballistic any day now.

Wouldn't surprise me if you were right, but I'm giving it a miss, even if were a dead cert.


Started getting into it, and thought I was doing ok.
Then got burned a little while back in a Bund/Bobl shootout, and it still hurts.


No one can (or will) explain to me in words I can understand what drives the damn thing.
I know bits but the bits I know don't add up, so I'm giving it a miss for that reason, as well as the remembered pain :)
 
I don't know how much you look at the bund mate but I've been buying it for the last few days up here and keep adding to it.

It looks to me like it's going to go ballistic any day now.

And there's another lesson right there!

Markets that keep coming back to major levels are going through them.
 
Following on from the previous post....

The Bund forms a triple top formation at all time highs.

It has a large sell off and then comes back up with price consolidating just beneath them.

You can take it this will go one way.
 

Attachments

  • bund.gif
    bund.gif
    19.7 KB · Views: 586
Last edited:
Dear Tom,
I have been paper trading using the methods you suggested on MMT. Many a times, you have commented that your charts were a bit different from some of those commenthing on the MMT thread. There the charts you were posting were primarily from 'MetaTrader'.
Currently, I am also using the same platform. I noticed that on 19th Feb, 2010 that there was a pin bar formation on GBPUSD. Since, it was in confluence with trendline and fibonacii levels, so I played it in the same manner you taught on MMT. Strangely, there was NO corresponding pinbar formation for GBPUSD on Oanda and dailyfx.com for the said date. I have attached the pictures of charts. On last Sunday night, Stockholm time, when markets opened, oanda charts started moving, but MetaTrader ones did not.
The question I want to ask you -> Which chart is the standard one? ofcourse it is not a good idea that different people see different charts. Is it that demo accounts are not real time?
Kindly suggest, which trading platfrom should be used for paper trading and real time? Here different platforms are showing different charts.
Thanks
 

Attachments

  • gbpusd.jpg
    gbpusd.jpg
    76.6 KB · Views: 317
  • dailyfx.com.jpg
    dailyfx.com.jpg
    109.4 KB · Views: 355
  • oanda.com.jpg
    oanda.com.jpg
    182.8 KB · Views: 340
Dear Tom,
I have been paper trading using the methods you suggested on MMT. Many a times, you have commented that your charts were a bit different from some of those commenthing on the MMT thread. There the charts you were posting were primarily from 'MetaTrader'.
Currently, I am also using the same platform. I noticed that on 19th Feb, 2010 that there was a pin bar formation on GBPUSD. Since, it was in confluence with trendline and fibonacii levels, so I played it in the same manner you taught on MMT. Strangely, there was NO corresponding pinbar formation for GBPUSD on Oanda and dailyfx.com for the said date. I have attached the pictures of charts. On last Sunday night, Stockholm time, when markets opened, oanda charts started moving, but MetaTrader ones did not.
The question I want to ask you -> Which chart is the standard one? ofcourse it is not a good idea that different people see different charts. Is it that demo accounts are not real time?
Kindly suggest, which trading platfrom should be used for paper trading and real time? Here different platforms are showing different charts.
Thanks

Hi Swedendenmark,

I've got two points to make.

1. The problem usually occurs because different brokers use different opening and closing times for each day. I was always taught to just play what you see. With this in mind, just try to look at one chart program and use that exclusively. I use FXPRO for charting. I also saw a pin.

2. You are not the only person that was caught out in that pin you marked on GBP/USD. But remember: mark your problem areas before you are in a trade.

You need to do as much due diligence in planning how you are going to manage the trade as you are going to put into nailing the entry.

The aim of the game is not to let the market catch you off guard.

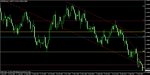
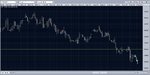
Look at the blue box on the first chart below. There is a minor swing low that has confluence with the 38% fib.

As J16 would say: price went exactly where you would think it would.

Did we know it would stall and turn down? No. But you can't be scratching your head wondering what happened if you take a loser here. Price was almost always going to struggle here. This is not rocket science. It happens time and time again.

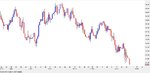
Now look at the second chart. I've circled all the points that jump out at me. As soon as I open a chart I see these now. I usually connect a line throught he middle of them and use this median level as my "problem zone"

With all this in mind, should one have even taken the trade? Well, I certainly wouldn't. As you may already know from my journal, Cash FX, I was short throughout this period and didn't consider cutting and reversing here.

At any rate, regarding the loss you took, remember that J16 and I use very different exit strategies.

I can't really speak directly for him of course but from what I know of his personal trading this is my rudimentary conclusion:

If you're a J16'er

You shouldn't have taken a loss there. You should have got half out and moved the stop up to breakeven minimum.

In short (and excuse my French) one should not f*ck about going against the trend into a level like that.

If you used the exit management technique I outlined in MMT

You would have held onto your balls and....taken a loss. Price didn't close through any overhead level so there was nowhere to move your stop. It would have been a loss IF one had taken it in the first place.

You have to decide what you are comfortable doing.

Back when I wrote that thread, presuming I would have taken the trade in the first place, I would have taken a loss there.

Now I would probably just get out of everything as we traded into the blue box.

But that's a different story for another day :)
 

Attachments

  • gbp.gif
    gbp.gif
    33.6 KB · Views: 554
  • gbp2.gif
    gbp2.gif
    36.7 KB · Views: 522
Last edited:
imo technical analysis is pointless. you need to know why and where markets are going long before a chart tells you.

most amateur traders use tech analysis, most amateur traders lose money

imo if you just trade off charts and pin bars and what not its not different to gambling..your taking a trade in the hope it works out
 
so you need to be a fortune teller Rothschild ? I remember before Christmas you said Oil was going to $60....
 
so you need to be a fortune teller Rothschild ? I remember before Christmas you said Oil was going to $60....

no you dont need to be a fortune teller.

yes i did, and yes i was wrong. cant get it right every time lol

in my defense i did stray from my usual strat and i paid for it.

i also know the exact reason i was wrong, how many of you can say they know exactly why there random TA pin bar punt didnt work?
 
imo technical analysis is pointless. you need to know why and where markets are going long before a chart tells you.

most amateur traders use tech analysis, most amateur traders lose money

imo if you just trade off charts and pin bars and what not its not different to gambling..your taking a trade in the hope it works out

I appreciate your point, I just totally and utterly disagree.

Is TA pointless? Probably the way most people use it is all I can really say.

But to insinuate that most amateur traders lose money because they use TA is horsh*t in my opinion.

Most amateur traders lose money because they have no idea what they are doing and to go along with that they are ill prepared mentally for what is the hardest game on earth.

What most don't realise is that whilst rading markets is relatively easy, trading money is extremely hard.

There's a difference between the two and it goes over the heads of most.

Ultimately, I don't believe you need to know why markets are going anywhere. That's for people that need an explanation for everything because it makes them feel comfortable.

What happend to make the S&P rally in the last five hours? I haven't got a f*cking clue but if you don't realise by now that getting long at 1085 is going to make you money nine times out of ten (unless you have no management skills whatsoever) then God help you. You really are better off being a fundemantalist!

The chart tells me exactly where the market is going and Thank God I can make money consistently reading it.

If I had to read the paper or use a pen and paper I wouldn't have time to get through eight seasons of 24.

Now don't get me wrong. A cup and saucer is what I drink tea from. MACD is lunch most days and a head and shoulders neckline break lands you in casualty not in the money.

But TA, at least to me, is knowing what levels the market will react to. It's knowing what people will see and how they are likely to act when they see it. It's knowing who is likely to have bought here and who is likely to have sold. It's knowing who is caught with their pants down.

When you stare at the markets for ten hours or more per day for several years and (here's the important part) you know what to look for, you just begin to see the patterns and the probabilities they have of playing out in a certain way.

To me it comes down to one thing and one thing only:

If you can't make money using just a chart, you're not reading it right :)
 
Last edited:
after all these years tho ur running profits of 100's of quid in on ur trades, no 1,000s?
 
after all these years tho ur running profits of 100's of quid in on ur trades, no 1,000s?

All those years? Dude I've been proifitable for about three years.

I spent seven making every mistake in the book.

What can I say? I'm a slow learner!
 
yeh thats what i mean, 3 years of being proftible and uve got a tenner a point etc on? ive traded over 100 corn contracts before and 50 crude contracts..

these attacks are nothing personal and i think you know that! but i think you need to hold your hands up and admit your not quite the trader you like to think you are and make out you are..
 
in regards to your rep comment.

it wasnt gold, his most famous move was after the battle of Waterloo hs riders set out before anyone elses and reached england with the news napoleon was defeated, he leaked that Britain had lost the war and as the markets crashed he quietly bought everything in site and when the news hit that britain actually won, well he became the richest man on earth (aparantly) we will never know the truth..

and your right these kind of edges dont exist anymore..but would have they existed to us mere mortals back then either? all we can do now is get as close to the inner circle as possible. I have contacts in ALL the pits and can really find out what the markets are up to, its all about who you know...
 
Status
Not open for further replies.
Top