Ideas for increasing trader performance

Status
Not open for further replies.
Hi Tom,

I agree with everything you have said about taking things OFF your chart, I did the same and at first it was difficult, but over time you begin to feel more natural with your chart, almost like a friend you've known for years! If you're using EMAs, Fibs, etc all the time and they stop working, the average trader is likely to panic.

I just wanted to ask you about this part I quoted though -- what markets do you trade? I am only sticking to Forex as I hate to hold positions overnight on other markets since they could gap, but I do want to start reaching out to others. What are your favorites?

I trade:

S&P500
FTSE 100
DAX
++++++++++++++++++++
GOLD
CRUDE OIL
++++++++++++++++++++
BUND
++++++++++++++++++++
GBP/USD
EUR/USD
USD/JPY
EUR/GBP
USD/CAD
GBP/JPY

I can tell you that while I traded the exact same way I outlined in MMT (e.g. hourly pins/inside candles at decent s/r levels with confluence) I kept detailed records on what markets I did best in. I did this not on a monetary basis but on a ticks/pips made basis for more accuracy.

Obviously I am not sure how statistically valid any of what I am about to say is for various important reasons:

- Sometimes you miss wildly profitable signals in some markets
- Sometimes you have lapses of discipline that lead you to take less than average signals leading to losses in others
- By random chance you can catch a huge move (an outlier if you like) in one particular market
- Some markets have more volatility (ticks/pips movement) than others which could skew the results.

However, for what it may be worth, the best performing market of all these for me was USD/CAD. So while I can't say it is the easiest or the one that will make you the best returns I can tell you is that it came out infront closely followed by GOLD. These two markets were way infront of the rest for me in terms of performance.

Of those markets all listed above I have been profitable in every single one over time with the exception of the S&P500.

There were a few markets I was net negative in over time. As a result these are no longer in my list of markets I trade. As I just said the main one was the S&P500 (The only reason I still watch this is because it is very important as a reference for when I trade the FTSE or DAX).

The other two main culprits were USD/CHF and AUD/USD. I performed so badly over time in these latter two pairs that I stopped trading both of them. Today, I still feel some anger when anyone makes me look at USD/CHF as nothing I ever did in it seemed to go right. As a result, this is my least favourite market to trade.
 
Last edited:
What I also draw from this thread though is just how experiential learning to trade price is and nomatter what great guidance is provided by Tom and MrGecko, there is still no substitute for having a go and making an @rse of it.

Totally. You know, I spent my first seven years making an @rse of it.

And guess what?

I still make an @rse of it. The only difference is, I make an @rse of it less often.

I'm paraphrasing Livermore when he said...you make a mistake and over time and especially if you are quick learner, you stop making it...then you make the brother of that mistake...you learn and move on...then you make the cousin of that mistake...and so on and so forth.

I'll make mistakes in trading for the rest of my trading career. I'm fully aware of that. But it's about making sure your mistakes a) don't cost you too much when you make them and b) you try not to make the same one more than once...
 
Excellent presentation, Tom!

Coincidentally, while still making my way through the behemoth J16 thread over @ FF (which imho is recommended reading material for all traders, both new and experienced) and watching some of Jim's free videos for the second time, last week, all of a sudden the principles of (ppz) break/retest became obviously clear to me. It was awesome to place a couple of lines on my chart, and then witness price breaking through, coming back and testing it again -to the pip-, before taking off again.

Not only does this seem to be a highly reliable phenomenon, but if you look closely, you'll see that it's happening everywhere, all the time. Not only after a trendline has been broken or after a breakout from a consolidation/congestion/traffic area, but also frequently during a trend will price pull back and touch the price level of the previous swing high/low. Even when there does not seem to be a retest of a former resistance/support/trendline, if you zoom in to a lower timeframe, you'll almost always see that price did in fact do a retest before taking off again.

Cheers,
Boy
 
Last edited:
Excellent presentation, Tom!

Coincidentally, while still making my way through the behemoth J16 thread over @ FF (which imho is recommended reading material for all traders, both new and experienced) and watching some of Jim's free videos for the second time, last week, all of a sudden the principles of (ppz) break/retest became obviously clear to me. It was awesome to place a couple of lines on my chart, and then witness price breaking through, coming back and testing it again -to the pip-, before taking off again.

Not only does this seem to be a highly reliable phenomenon, but if you look closely, you'll see that it's happening everywhere, all the time. Not only after a trendline has been broken or after a breakout from a consolidation/congestion/traffic area, but also frequently during a trend will price pull back and touch the price level of the previous swing high/low. Even when there does not seem to be a retest of a former resistance/support/trendline, if you zoom in to a lower timeframe, you'll almost always see that price did in fact do a retest before taking off again.

Cheers,
Boy

Thank you for posting DHB. I think it's an incredible experience when you finally see and understand this properly for the first time.

Now you can see it, don't take your eyes off it...this pattern is the key to the markets rhythm and you'll never view the markets the same way as you used to again.
 
Honestly, the day I really got it, I walked around with a huge smile on my face. It is indeed a immensely powerful experience, and the (touch) trading implications are -after a sufficient amount of proven demo consistency- very potent. :D
 
Those that are bullish stocks will be looking to get in long around these levels. FTSE looks the most promising. Wait for it to set up right for you. If it doesn't, pass on it.

This looks very promising to me now particularly in light of this news.
 
Tom - on E-mini do you graph only for regular trading hours or do you examine s+r through the entire 24hr period?

I ask because I find that only tests during RTH when there is volume seem to count for me. However activity during FTSE and Nikkei trading hours give clues too, especially when it comes to 13:30 US news annoucements like today.

Do you have a view?

I examine s/r throughout all hours...
 
... test of the RTH high's and low's at the open can often provide useful clues as to what the action is likely to be during the day
 
So today as an example, the 13:30 news pushed price down to test support from last night at 38 and then recovered just prior to open back to roughly yesterday's close. Then it rallies to yesterday's high and bounces off.

Now I'm waiting for a second test of 38 in RTH today and if I get confirmation, go long. What do you infer from today's movements out of curiosity?
 
... test of the RTH high's and low's at the open can often provide useful clues as to what the action is likely to be during the day
This sort of thing ?Please feel free to annotate the chart if I have got it wrong-which I probably have:eek:
 

Attachments

  • rth.jpg
    rth.jpg
    185.1 KB · Views: 473
So today as an example, the 13:30 news pushed price down to test support from last night at 38 and then recovered just prior to open back to roughly yesterday's close. Then it rallies to yesterday's high and bounces off.

Now I'm waiting for a second test of 38 in RTH today and if I get confirmation, go long. What do you infer from today's movements out of curiosity?

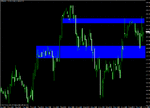
I infer pretty much what you did. Poor retail figures and higher unemployment pushes price down in the knee jerk reaction that is so common - I'm sure lots of eager shorts rush in to try and clean up...price comes right into the blue box which although looks wide only covers 3 handles (8 ticks in the futures) and then bounces.

It rallies right up, breaks yesterdays highs, gets lots of nervous bears to cover as it looks bullish to the untrained eye...at which point it turns at the higher blue box.

I personally am bullish because it looks bullish to me on the higher time frames but longs for today needed to enter at the lower blue box, get some out at the higher and wait...
 

Attachments

  • s_and_p.gif
    s_and_p.gif
    30.9 KB · Views: 573
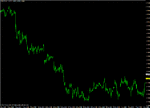
For those of you that missed it, everyonerich posted a chart of the Euro and wrote "so based on your strategy, wait for market break the line, then wait for pullback before jump on board?"

This was where the market was when he made the post.
 

Attachments

  • eur1.gif
    eur1.gif
    21.4 KB · Views: 579
I personally am bullish because it looks bullish to me on the higher time frames but longs for today needed to enter at the lower blue box, get some out at the higher and wait...

Me too. If you look at weekly and daily, it's quite astoundingly bullish right now.
 
For those of you that missed it, everyonerich posted a chart of the Euro and wrote "so based on your strategy, wait for market break the line, then wait for pullback before jump on board?"

This was where the market was when he made the post.

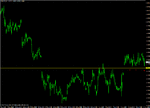
This is what the market did after.

Everyonerich, it's magic!

You just called a 94 pip move on the exact turning point...followed by a 126 pip move shortly after....nice work! :)
 

Attachments

  • eur2.gif
    eur2.gif
    25 KB · Views: 671
This sort of thing ?Please feel free to annotate the chart if I have got it wrong-which I probably have:eek:

It's a little trickier w/ currencies because there are no defined "session times", but there is no reason why you shouldn't apply the same principles.

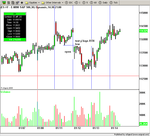
Here's an example in the SP500... opening outside yesterdays range (indicating a change in circumstances), it drifted up to test the RTH low of the previous day, then sold off.

Another example might be in an uptrend, price opens within y'days range, drifts down to test y'days RTH low, then reverses and trends higher during the day.

As always there are no hard n fast rules though, you gotta use your noggin - but it's usually a good idea to keep an eye on the previous days highs and lows to see what goes on if you get there.
 

Attachments

  • Sp500_opentestdrive.png
    Sp500_opentestdrive.png
    31.8 KB · Views: 483
I infer pretty much what you did. Poor retail figures and higher unemployment pushes price down in the knee jerk reaction that is so common - I'm sure lots of eager shorts rush in to try and clean up...price comes right into the blue box which although looks wide only covers 3 handles (8 ticks in the futures) and then bounces.

It rallies right up, breaks yesterdays highs, gets lots of nervous bears to cover as it looks bullish to the untrained eye...at which point it turns at the higher blue box.

I personally am bullish because it looks bullish to me on the higher time frames but longs for today needed to enter at the lower blue box, get some out at the higher and wait...

BTW Tom, I forgot to ask and it's with reference to your blue bands. I tend to pick specific levels to trigger entries, usually with some form of price confirmation or gut feel on when you can see a reversal building up. Do you work specifically on price entering a band and then showing confirmation (this is pertinent where you know levels are congested).

Just curious really.
 
This is what the market did after.

Everyonerich, it's magic!

You just called a 94 pip move on the exact turning point...followed by a 126 pip move shortly after....nice work! :)

If you don't mind, I've added a few trade entry locations to the chart, which occurred before E/U got caught in the range it just broke out of, which illustrate perfectly what I was talking about earlier when mentioning retests during trends.

You could have traded these as separate trades, but you could have also used the new retests as entry points to add to the position(s) you already had open. T_D referred to this both in his MMT thread here on T2W and in the J16 thread over at FF (a certain wheat trade, if I'm not mistaken). Risk-free pyramiding. Definitely something to look into once you start to get the hang of this stuff (which, for the record, I'm not claiming to do btw).
 

Attachments

  • eur1(2).jpg
    eur1(2).jpg
    150.2 KB · Views: 451
This is what the market did after.

Everyonerich, it's magic!

You just called a 94 pip move on the exact turning point...followed by a 126 pip move shortly after....nice work! :)

youre welcome. actually i just followed what you said in pdf.. :)
 
Status
Not open for further replies.
Top