How To Trade: Full Stop

Status
Not open for further replies.
Sorry, but I only help those who are able to help themselves, and others.

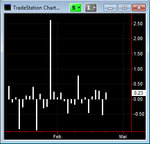
Should you care to partake, and advance the learning of the students a bit more, we also now require an explanation of this next graph. I know DT will get it with his fancy TS programming, but it is also very simple to get it with excel (as simple as Charlton's post) and we can use the vast experience of the MSFT programmers, for free.

As I keep saying, this is all basic stuff, as some posters have rightly pointed out. However, it is the basics that matter most, in any job.


Hmmmm... I'm struggling without the symbol. I would say that based on the above
chart, bar number 17 represents a day that had at least one of :

- earnings release
- broker upgrade
- major news release
- company issuing new guidance
 
Hmmmm... I'm struggling without the symbol. I would say that based on the above
chart, bar number 17 represents a day that had at least one of :

- earnings release
- broker upgrade
- major news release
- company issuing new guidance

Don't know but the ticker clue might be in the question i.e. Microsoft. Since the blue bars are both above and below the line, then we know that the value being measured can be positive or negative. Assuming we have moved on from the previous examples where the possibilities within single bars have been exhausted, I suspect this might be to do with differences between each bar and its preceding bar e.g. H this bar - H last bar or O this bar - C last bar or H-L this bar - H-L last bar etc.

However if I am right in thinking that this now involves more than one bar at a time, the number of combinations of HLOC become many times greater and I don't have time to consider them, especially without being certain of the symbol.

Charlton
 
All this rubbish about brokers and cheap commissions, are just that, rubbish.

If you trade 100K shares at a time and look for a 1c move (that will give $1000) then commissions are critical. If you are using IB then this is not possible as your costs will exceed your profit. If you have commissions that cost $250 for this trade (as some do) then you have made $750 net profit. Factor in dark pool routing systems and do this several times as day and it is a highly viable trading approach. Trading stocks such as C where it is normal to have 250M shares traded in a day and the fact that the range is very low and that the Bid and Ask often do not change for over 1 hour then this gives a very low risk trading approach as well.

It is not suited to normal retail trading but it does work and is it highly profitable.


Paul
 
I hear what you say Charlton - but there are a limited number of combinations of OHLC that make sense.

I thought it may have been.
- the gap
- difference between close & prior close
- just plan old net change for the day

However - having scanned for these, I can't find a stock that fits. Of course, you could probably figure this out by knowing the date of bar number 17.

In any case, it is an interesting exercise for the nerds amongst us.
 
Hmmm - not sure why I didn't see this first time round. I certainly looked there. :confused:

attachment.php
 

Attachments

  • homework.jpg
    homework.jpg
    31 KB · Views: 837
Hmmm - not sure why I didn't see this first time round. I certainly looked there. :confused:

attachment.php

Good on you DT, you are as they say "spot on".

Here is a little fact that many may not be aware of.

elf
Not the cute creatures we've been spoon-fed by the media. Elves in
traditional folklore sat on people's chests while they slept to give them
bad dreams. They also stole human children and substituted deformed
fairy children. Wonder if Santa is really a crack dealer.


Shortly, I will post an interesting picture that should be of interest to those who are beginning to understand what this thread is all about.

Following that, we shall then start to look at actual trades that have been executed, but you must understand what we are all about right now, else you will be totally lost when it comes to the trades.
 
BTW, would anyone care to list the ranges for today, based on what symbols we have mentioned so far?
 
Good on you DT, you are as they say "spot on".

Here is a little fact that many may not be aware of.

elf
Not the cute creatures we've been spoon-fed by the media. Elves in
traditional folklore sat on people's chests while they slept to give them
bad dreams. They also stole human children and substituted deformed
fairy children. Wonder if Santa is really a crack dealer.


Shortly, I will post an interesting picture that should be of interest to those who are beginning to understand what this thread is all about.

Following that, we shall then start to look at actual trades that have been executed, but you must understand what we are all about right now, else you will be totally lost when it comes to the trades.

Hi TE,
I may be wide of the mark here but, based on their posts, only DT and Charlton appear to have any real idea of what's going on. If you only want to preach to the converted, then please carry on, but I would have thought that's rather a waste of your time. If, on the other hand, you are sincere about wanting to help those of us who are less able, then you'll need to modify your 'teaching' techniques. I declare myself as lost already, so there's not much hope for me when it comes to the trades!
;)
Tim.
 
Cant say ive been keeping an eye on this thread.
He is just posting the ranges of various symbols in bar chart form, no?

Dont know how DT was able to work out what stock it was from. Maybe there is a feature in tradestation that lets you scan things like that? I dont know. weird.
Gotta laugh at being asked to explain graphs without any labels tho! haha.
 
Hi TE,
I may be wide of the mark here but, based on their posts, only DT and Charlton appear to have any real idea of what's going on. If you only want to preach to the converted, then please carry on, but I would have thought that's rather a waste of your time. If, on the other hand, you are sincere about wanting to help those of us who are less able, then you'll need to modify your 'teaching' techniques. I declare myself as lost already, so there's not much hope for me when it comes to the trades!
;)
Tim.

For previous graphs we know that they were looking at high - low ranges for the blue bars and close - open range for the maroon bars. The main clue is that the blue bars were always +ve, which high - low will be (or possibly zero). Close - open can, however, be +ve or -ve.

The bars are numbered from right to left and the assumption is that 0 or 1 is the current bar and that they go backwards. You then need to guess the interval, which was daily.

Now all of the previous assumptions are more easily made if you know the symbol, because you can look up the prices and try out the two most probable ranges.

Once all that is established then it is indeed possible, within Tradesation, to produce a scan based on a filter. Thus if you choose a significant bar e.g. the highest or lowest and determine the day on which it occurred by counting back, then you can set up an indicator with the following type of script

e.g If Date = 28/01/2010 then value1 = close - Open;

Within TS you can scan a universe of symbols e.g. all NYSE + all NASDAQ against this condition to get likely candidates.

If you plot value 1 as a histogram you can then see if you have a matching pattern.

This is an exercise akin to be handed all the letters contained in all the answers of the Times crossword and not being given the clues either. You are then required to complete the crossword !

You will have to ask DT whether the final graph displays the same range and what its symbol is because I have not made any determined attempt to solve that one.

Charlton
 
C range was 3.37 to 3.45 or 8 cents.


Paul

Forget about C, unless you are part of the deep discount gang. I do not agree with recent comments about very low commissions and trying to capture just a few cents, to me that is unprofessional and a waste of valuable time. As well as that, this mentality that you have to have an account set up with a broker, and funds in excess of $25K to daytrade effectively, is another load of rubbish. Depending on where you have your trading account, you can still get 4:1 leverage, and more even, although the commissions will be higher, but you can not have the best of both worlds, all of the time.

It is all relative to what your targets are.

I have no interest in, nor do I want to hold any discussions with, so called "financial professionals", as I know that most of what they tout is pure and utter rubbish. I am not called TE for nothing, and I know what works best and where the best value can be obtained, for several markets, but for the purpose of these lessons, we will not digress from daytrading US stocks.

As mentioned previously, it is a free world and the "ignore" button is but a click away, as I have no real interest in crowds or gangs, I just like to keep it plain and simple, same as my daytrading.

I must say, I am a bit disappointed that there has not been more questions and postings, for I have given enough information for any level headed person to construct the basis of a solid trading approach, that actually works for daytrading US stocks, but very few are grasping what it is all about. So be it, as I am only interested in helping those who help themselves, and others.
 
For previous graphs we know that they were looking at high - low ranges for the blue bars and close - open range for the maroon bars. The main clue is that the blue bars were always +ve, which high - low will be (or possibly zero). Close - open can, however, be +ve or -ve.

The bars are numbered from right to left and the assumption is that 0 or 1 is the current bar and that they go backwards. You then need to guess the interval, which was daily.

Now all of the previous assumptions are more easily made if you know the symbol, because you can look up the prices and try out the two most probable ranges.

Once all that is established then it is indeed possible, within Tradesation, to produce a scan based on a filter. Thus if you choose a significant bar e.g. the highest or lowest and determine the day on which it occurred by counting back, then you can set up an indicator with the following type of script

e.g If Date = 28/01/2010 then value1 = close - Open;

Within TS you can scan a universe of symbols e.g. all NYSE + all NASDAQ against this condition to get likely candidates.

If you plot value 1 as a histogram you can then see if you have a matching pattern.

This is an exercise akin to be handed all the letters contained in all the answers of the Times crossword and not being given the clues either. You are then required to complete the crossword !

You will have to ask DT whether the final graph displays the same range and what its symbol is because I have not made any determined attempt to solve that one.

Charlton

As Charlton was kind enough to spend some of his valuable time posting, I will expand.

A standard chart is constructed using 4 pieces of data in various time periods, the OHLC, and anyone who has ever looked at trading knows this.

If, when you look at a chart, you do not see the OHLC, and instead you see a myriad of other things, then odds are your are going to get screwed, for that is exactly what they will do to you.

You must, and I will repeat again, You must, know your ranges if you are to succeed at daytrading Us stocks. If you are stupid enough to play around with silly shapes and squiggles, then you deserve exactly what you will get.

Fail To Plan, and, Your Plan Will Fail
 
BDX - range 1.28, open to close .92, 'mystery value', .03
DD - range .56, open to close .03, 'mystery value' .27
 
Status
Not open for further replies.
Top