But just because these fears are normal, doesn’t mean they’re right. The truth is, you shouldn’t waste your time trying to figure out what the market will do next. Instead, let the market tell you when the decline is over and there are a few ways to do this. Today, I want to look at a simple one you could follow on any free charting site…
Time The Next Market Bottom With This
In the past few weeks, we’ve looked at momentum which you can use to sidestep major crashes, stay ahead of the Fed and predict which stocks will go up. But if that’s not enough, you can also use it to time market bottoms. Take a look at the chart below:
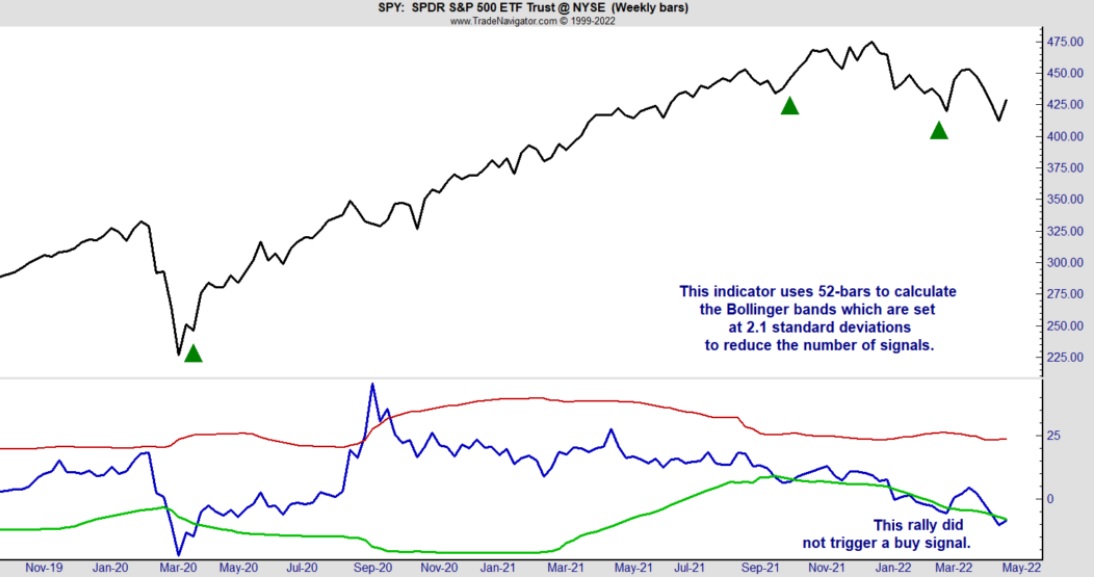
This is a weekly chart of SPDR S&P 500 (SPY). The blue line at the bottom is the simplest momentum indicator out there: the rate of change (ROC). To find ROC, you calculate the percentage price change over a defined time. For this chart, I used 26 weeks.
The red and green lines are Bollinger bands that I added to the indicator. Bollinger bands are usually drawn two standard deviations above and below the indicator. In theory, these bands contain 95% of the indicator’s moves. To trade with Bollinger bands, wait for the indicator to move outside the bands.
ROC should be below the lower band less than 2% of the time. When it does break below it, you know we’re in an unusually strong decline. The buy signal comes when ROC returns to normal and moves back in between the bands and this has happened three times in the past two and a half years. The green arrows on the chart mark these buy signals… And each time, they were followed by a rally.
Now, you’ll notice that the blue line broke above the upper band around September of 2020 — but it wasn’t followed by a sharp decline. The rally continued. That’s why I only use this indicator for buy signals. There are other tools that are more helpful when determining when to sell.
But right now, this chart is offering an important message…
It’s time to get ready to buy.
This is a weekly chart, so you only need to check it once a week. But it’s important to follow this indicator now, if you want to catch the next buy signal.
Michael Carr can be contacted on this link: Michael Carr