How to tell if a market is ranging or trending

SuperDriveGuy

Active member
Messages
129
Likes
1
Hi All,
Sorry, if this has been asked before, I have trawled through various posts with bits and pieces of information on trending and ranging markets. So I will make my questions very specific.

Q. How can one tell if a market is trending or ranging?
Some Background:- basing say on a 10min TF, is it as simple as saying when the 20 MA crosses above the 50 MA the market is trending and when the 20MA cops about the 50MA it is ranging? or is there more to it? The reason I ask the question, is I have a good system that works in ranging markets, but is an absolute disaster when the markets are trending. So my thinking is if I can determine when the market change from ranging to trending, I can stay out(OR I can come to the next question)

Q. Which are the "good" simple trend following systems?
Some Background:- again basing on a 10M TF, is it as simple as saying buy the pullback when the price is well above the 20MA, pullbacks to it and continues forward? Or buy the cross of the 20MA over the 50 MA etc? What does one do when the pullback is not actually a pullback but a reversal? so is not then a ranging market? or does one have to a X number of successive pullback to say the market is definitely trending? I understand that on different timeframes the market can be ranging and trending at the same time.

Any thoughts?

Thanks in advance.

Regards,

SDG
 
Last edited:

Average Directional Movement Index
(ADX)

The Average Directional Index, or ADX, was developed by J. Welles Wilder to determine trend forces, whether the trend will grow on or will gradually lose its positions. This indicator lets analyze the market tendencies and make trading decisions in the Forex market.

In fact, ADX relates to the class of oscillators, which changes positions in a range from 0 up to 100. Though the indicator's fluctuations are in a range from 0 and up to 100, it seldom goes over a point of 60. If the value is lower than 20 demonstrates a weak trend, if the value is over 40 shows a strong trend. Position above 40 indicates both strong descending, and a strong ascending trend.
. . . . . . . . . . .
Read complete article:

http://www.forexrealm.com/technical-analysis/technical-indicators/average-directional-index.html
 
Higher Highs + Higher Lows -> Upside bias to price discovery
LH's + LL's -> Downside "" ""
LH's + HL's -> Consolidation
HH's + LL's -> avoid

Prev. High ~= Recent High / Prev. Low ~= Recent Low -> Rangebound

It's more of an art than a Science
 
Higher Highs + Higher Lows -> Upside bias to price discovery
LH's + LL's -> Downside "" ""
LH's + HL's -> Consolidation
HH's + LL's -> avoid

Prev. High ~= Recent High / Prev. Low ~= Recent Low -> Rangebound

It's more of an art than a Science

Thank You, MrGecko and Songcon!
 
You say your system works when ranging... after your first loss, what is the result of the next trade? Is it a string of losses? If so, then after your first loss, take a step back and check that the market hasn't started trending.

It's more of an art than a Science

Oh, yes. Wreaks havoc for OCDers. :D
 
ADX is the nearest to a real-time indicator for trend or non-trend.

But otherwise, the question cannot be 'Is the market trending?', its 'Was the market trending?' Trend-following strategies basically involve taking a position in the direction of a trend that has already been occurring, in the hope that it will continue. That's why they are very correctly called trend-following, rather than trend-entering. Its impossible to literally enter a trend.

This isn't just semantics. The psychlogical power of a trader's belief that he/she has entered a trend and therefore must win can be powerful and lead to irrational position management - trading what you think, not what you see - leading to widening or igoring stops for instance. Trading has to be seen as a game of probabilities.
 
tomorton - Thank you for the insight! I'm just starting out and still playing with demos to get the hang of the different software I'm going to need. Do you have any quick suggestions that will keep me on track?

Thanks,
DJ
 
I take most information from price action and try to keep away from indicators. ADX is OK but I try to get confirmation from a series of indications that a trend is in place – consistently moving price over different timeframes, different MAs in the right layered formation, price avoiding crossing MA, consistent MA slope. Most of all I look for progressions of higher swing highs or lower swing lows, just using daily HL bars, usually looking for swing points that are not less than 3 days apart.

The thing about trend is it demonstrates a golden rule of TA better than almost any other question – If you have to look for it, its not there.
 
Look at a smaller (larger TF) scale chart. The eye is better than indicators.
 
Tushar Chande wrote a decent book which includes a section on ascertaining trend-ness (I think it's called "Beyond Technical Analysis"). Amongst other things, he suggested looking at ADX moving above its own moving average as an indicator of trend. ADX can suffer when price has a big discontinuous move, and this gets round that slightly. Check out his book.
 
Trending and ranging is very relevant to the time frame you are trading.
A market that is ranging on a daily or weekly chart can trend quite nicely on a 4hr/1hr chart.
Perspective is everything.
 
One defintion is:

When price is captured between the high and low of a previous swing - price is neither making new highs or new lows, therefore price is rangebound.

This is easy to spot I think, and no indicators required.
 
Higher Highs + Higher Lows -> Upside bias to price discovery
LH's + LL's -> Downside "" ""
LH's + HL's -> Consolidation
HH's + LL's -> avoid

Prev. High ~= Recent High / Prev. Low ~= Recent Low -> Rangebound

It's more of an art than a Science

:smart:

absolute gem, very wise words

thank you
 
One defintion is:

When price is captured between the high and low of a previous swing - price is neither making new highs or new lows, therefore price is rangebound.

This is easy to spot I think, and no indicators required.

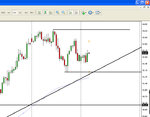
It looks like the image attached (curently seen on Cad/Jpy H4) and fits Mr. Gecko's LH's & HL's description.

Why avoid the HH's & LL's pattern Mr. Gecko? Doesn't that make for a megaphone pattern - very bearish, and reasonably tradeable too?
 

Attachments

  • cy_rb_h4.jpg
    cy_rb_h4.jpg
    104.1 KB · Views: 400
I have the complete opposite problem I get kill during ranging markets and do very well during tranding.

We should cooperate jajajajaj
 
your q. is invalid! "How to tell if a market is ranging or trending"

a market is moving up and down. some losers defined averages. based on averages it seems like a market ist trending and ranging. losers didnt earn any money with averages in the last 100 years.
 
Re: your q. is invalid! "How to tell if a market is ranging or trending"

a market is moving up and down. some losers defined averages. based on averages it seems like a market ist trending and ranging. losers didnt earn any money with averages in the last 100 years.

What on earth does that mean, "losers didn't earn any money with averages in the last 100 years"???
 
"some losers defined averages"" but they didn't earn any money with averages in the l

do u feel better now ?
 
Top