how to know end of a trend

charcoalstick

Junior member
Messages
39
Likes
1
hOW to know a trend has come to an end apart from top/ bot pattern double bot/top, reverse shS/shs ?...by the time the neckline is broken, price has probably moved some distance from top/bot..any OTHer means to spot possible turning pts fASTER (other than indicators)?
 
An uptrend changes to down just after I have gone long. A downtremnd changes to up just after I have gone short.

Personally, I think chasing turning points is a road to frustration, but maybe this can be drawn into a serious strategy - set orders for long and short simultaneously above and below suspected turning point - run with the one that breaks into profit?
 
hOW to know a trend has come to an end apart from top/ bot pattern double bot/top, reverse shS/shs ?...by the time the neckline is broken, price has probably moved some distance from top/bot..any OTHer means to spot possible turning pts fASTER (other than indicators)?

... and that's the million dollar question!! ;)

Millsy offers some good advice though...High Volume accompanied with a tight range is one clue... I would suggest studying VSA concepts as this would help...

Chorlton
 
If the traffic lights signal green for up and red for down then the transition between the two is accompanied by a series of amber lights. In my view there is no one thing that will tell you the trend is finished.

What people use to light the amber lights is a matter of personal choice, as is the number of amber lights that need to blink in order to extinguish the trade.

good trading

jon
 
.......which is the first pullback

Er..... sometimes :eek:

Seriously, that works well for me, with a low risk ratiio.

Split

Kinda what I do. Wait for a change in direction followed by a retrace and then a continuation in new direction.
 
  • Like
Reactions: BSD
Kinda what I do. Wait for a change in direction followed by a retrace and then a continuation in new direction.
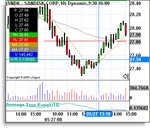
Yep, me too. Long on the X hairs of attached chart.
 

Attachments

  • X0002_05_08_SNDK.gif
    X0002_05_08_SNDK.gif
    18.6 KB · Views: 429
  • Like
Reactions: BSD
... and that's the million dollar question!! ;)

Millsy offers some good advice though...High Volume accompanied with a tight range is one clue... I would suggest studying VSA concepts as this would help...

Chorlton

yeah, a splike up vol is a common sign..

but can i know what is VSA?
thanks!
 
One or more of the following

Volume climax at top or bottom
Parabolic/Vertical move - Unsustainable acceleration
Waning momentum - shown as momentum divergence
Trendline(s) break and failed re-test

and maybe when Jo/Joanne public are heavily involved in market - think Nasdaq in 2000, Crude Oil now etc
 
draw a line from the top of the blue highest volume and over the top of the red volume at the lowest point and see that it will ends exactly where the trend will end with the highest red volume. I chart the volume instead.
 
The problrm is even if you do see lower pivot highs (in an uptrend) or divergence indicating end of the trend, switch to a higher time frame and the trend looks as good as ever!

I guess volume climax is a good
 
The problrm is even if you do see lower pivot highs (in an uptrend) or divergence indicating end of the trend, switch to a higher time frame and the trend looks as good as ever!

I guess volume climax is a good


In this instance, if one was looking to identify a reversal point then why would you switch to a higher timeframe for confirmation of the reversal?

The fact that its "higher" means that its always going to lag behind the lower timeframe. However, If the higher timeframe was important for confirmation in ones analysis then you might as well only focus on that particular timeframe.

Just my 2cents,

Chorlton
 
In a Market Profile context you would look for evidence of development. This means the formation of an area with a width of 3 or 4 TPOs. However, this only tells you that the market has paused and come into balance, not the same as spotting a reversal unfortunately.
 
Top