How I trade crude oil

Foroom.

I disagree, one should be predicting direction within their individual gaming plan. Oil, yes can be a little volatile, BUT still adheres to market structure and principles. Oil set ups for swing trading occur more frequently ( I hold anywhere between 3 days and 2 weeks). Ergo, of course one can gauge direction. Markets aren't complicated, break it down to its simplest form, demand/supply and look for imbalances.

Give us foresight signal in advance and post them here.
 
Give us foresight signal in advance and post them here.

On 25th April I went short oil light crude.

I went short because daily chart showed me short trend.

I used 1 hour chart for set up. I could see a level 49.55, hit previously and it went short and on the day the 1hr bar at 9am and 10am hit the level leaving wicks at the top, to me it showed an area where sellers were pushing down.

5 min chart could have shown great entry at 49.50 (look at the pattern, the price action on candle bar, and if you wanted stoch and RSI could have helped)

I got in earlier at 49.35 , I didnt want to 'miss the train'.

Went offside a bit, but no worries came in onside as low as 49

I got out at 49.08

nice little profit.

I have noticed other areas where this same type of set up could have worked, but I have been away from trading for a week or so.

Tomorrow will analyse the charts again and see if I can keep making money off oil
 

Attachments

  • oil 5 min chart entry.png
    oil 5 min chart entry.png
    96.1 KB · Views: 293
  • oil short 1hr chart 25th april.png
    oil short 1hr chart 25th april.png
    94.8 KB · Views: 283
Give us foresight signal in advance and post them here.

This is the exact problem with this industry, people want the ''easy way'', if I gave you direction - how will that possibly help you and you're trading plan?? It doesn't there are no quick fixes, trading takes time, effort, experience and more importantly heart, we are in a performance orientated profession - every day we stand up to the podium, everyday we step in the ring against better funded, better resourced, more experienced traders; the only thing or positive I can draw is my work ethic, I will not be outworked. I trade intraday 5 days a week, have 2 international study groups to polish skills, I practice every single day for 2 hours (at weekends I write up my trades for the week and highlight my weaknesses and strengths and then incorporate the needed structure for improvement) premarket analysis a further 2 hours, and an hour a day to learn new material. This is how wining is achieved in the markets, I have one setup with a 93% success rate, this started at 55%, it's only through highlighting weaknesses and incorporating them into ones practice, can we grow and improve. It frustrates me that people want the holy grail, the easy way out, there ISN'T!! The real question is how hard are you working, more importantly how smart. It isn't about the methodology or strategy, this is discretionary - moving average cross over setups, work!! 100% something this simple, BUT you need to know the filters, when to use them, how to use them correctly, and the limitations of the trade itself. (for the record im from the school of Wyckoff) we all have different risk tolerances, different levels of validation through an indicator to instil confidence to pull the trigger etc. A throw away comment asking for direction, helps no-one!?! Work harder and smarter. Good luck
 
every contract i allow myself 3 adds..

thats one of my rules that i use to keep myself out of trouble...no more than 3 adds for risk management
 
oil draw down announced today

price action to me looks like (on daily chart) bulls will come back in and take it to around 50.26 mark

on 1hr chart tmrw I'll look for long opportunity if price action shows me it and I'll post result on here

would you guys agree with long?
 

Attachments

  • oil light daily.png
    oil light daily.png
    80.6 KB · Views: 342
  • oil light 1hr.png
    oil light 1hr.png
    87.7 KB · Views: 283
oil draw down announced today

price action to me looks like (on daily chart) bulls will come back in and take it to around 50.26 mark

on 1hr chart tmrw I'll look for long opportunity if price action shows me it and I'll post result on here

would you guys agree with long?

Are you looking at taking bites of the cherry up to 50, or to stay in for the duration?
If you are staying in for the duration, where will you putting (or trailing) your stop?

I was long at 45 a couple of day ago, I was looking for a target of 53, but I exited at 46.70, thinking it looked a bit choppy. I meant to get back in at 47.12. But never did.
 
Last edited:
Are you looking at taking bites of the cherry up to 50, or to stay in for the duration?
If you are in for the long trip, where will you putting your stop?

If tmrw shows me a support level, where i can go long, i'll enter on 5 min chart.

I've never held any trade overnight etc im new to trading and not big time (not to say if it wasn't a good trade I wouldn't hold on!)

50.26 is just a level id be weary of not get out of exactly, if opec cuts continue etc could see oil climb much higher then this. i dont trade news but hard to not take account of it in a commodity like oil....if cuts continue ive read on bloomberg and retuers arcticles oil could hit 60 or 70

if i get an entry tmrw ill post how i entered on daily, 1hr and 5 min charts
 
I trade everything, but I do love oil. I just feel at home with it.
My holding time is for as long as possible, usually from 3 days to 6 months.

I have found that often the price will go where the charts point it will go, but at a time that
suits the news items. Like you are waiting for it move (using technicals) the price stays in a tight range.
Then unexpectedly news is released and then price goes merely on its way, to an area you were expecting it go.

If you wanted to try holding for longer periods, but are put off by the extra expense on the bigger stop you could spread bet with a company called Finspreads, they offer 10p a pip. I have never used them so I can't particularly recommend them.
In the mean time if you do end up holding through the night, just remember to have a stop in place,
guaranteed if possible.

Have fun, but make sure its safe fun!
 
I suppose WTI will meet the OPEC meeting at $55 per barrel to have a room to fall in case they fail to reach an agreement. yesterday upsurge basically has not hurdles, now the rally continues I guess there is not much resistance above, just a lull typical for May.
 
I was long at 45 a couple of day ago, I was looking for a target of 53, but I exited at 46.70, thinking it looked a bit choppy. I meant to get back in at 47.12. But never did.
Table m, I got back in this morning, hope you did.(hopefully I will hold it this time!)
 
Table m, I got back in this morning, hope you did.(hopefully I will hold it this time!)

well done! daily to me looks defo still bullish

I didnt get in, because I had my level too low, from yesterday, see the chart where the arrow is.

There was an opportunity to go long on the 5 min chart at 3pm , see the chart. 47.19 would have got me in, go onside, stop to lock in small profit, and so far its still on upside.

however, because this didnt follow my strategy of going in at levels of sup/res on daily or 1hr.

I've always been tempted to go in on 5 min charts alone, and just go with trend, but i've never brought myself to do it.

I'll try again tomorrow....
 

Attachments

  • oil 1hr chart.png
    oil 1hr chart.png
    100.7 KB · Views: 915
  • oil 5 min chart.png
    oil 5 min chart.png
    174.5 KB · Views: 491
oil need mooooor to confirm Steadily uptrend

oil need mooooor to confirm Steadily uptrend
 

Attachments

  • oil long term.png
    oil long term.png
    63.3 KB · Views: 313
Table m, I got back in this morning, hope you did.(hopefully I will hold it this time!)

I did a long trade late on friday evening.

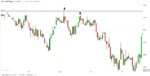
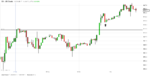
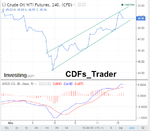
See daily chart: for me, price action was bullish, price closing higher, long thick green candle bars (couple of red candles but overall green, higher positive closes showed me bullish).

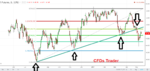
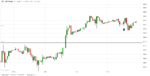
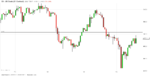
1 chart: I had an 'intraday' support line lets say, of 47.91, the previous day this was also an area where the price action had gone up.

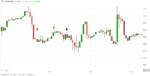
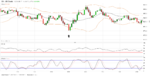
When the price dropped below this level I switch to 5 min chart for entry, see chart attached.

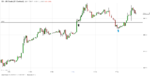
I went long at 47.87 at 15.25

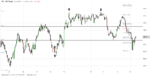
I looked for candle bars outside bollinger, sotch and rsi to be on their extremes. Ideally would have got in lower.

It went offside a bit , but then came back in the money.

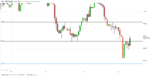
I came out at 47.95, not huge profit but it was late on friday and I don't hold positions over night (or weekend!), but noticed that at 8.30pm price got to as high as 48.20, if holding this could still be in the money now.

This was not the ideal entry, as usually I wait for the 1 hour candle chart to close before entering, so I would have entered after 4pm. And using my 5 min entry strategy, i wouldnt have gone in after 4pm.

Bit of complacency in sticking to my strategy, but I went for it maybe out of boredom trading.

Will try and show a better entry for oil if i get one next week.
 

Attachments

  • oil 5 min entry.png
    oil 5 min entry.png
    175.3 KB · Views: 288
  • oil 1hr.png
    oil 1hr.png
    94.9 KB · Views: 296
  • oil daily.png
    oil daily.png
    137 KB · Views: 304
Daily- looks bullish to me still, wondering if there will be some resistance at 50.28

I used fib levels on the daily to help with my entry of where to go long

I use an out of hours order and the market hit my order and level pretty sweet, see the 5 min chart for entry. Notice candle bar outside of bollinger and RSI and Stoch on extremes.

On the 1 hour chart I had 4875 as a level of support, anything below this was good place to long for me.

The hour chart showed my price level as a good entry, almost like a swing point (I think)

Im still holding this trade, only 1 contract but if it retraces back to $55 or more will be a nice profit for me.

I have a stop in to take small profit , so worst comes to worse at least I dont loose anything.
 

Attachments

  • oil 1hr chart.png
    oil 1hr chart.png
    92.6 KB · Views: 826
  • oil 5 min entry.png
    oil 5 min entry.png
    176.4 KB · Views: 298
  • oil daily.png
    oil daily.png
    88.4 KB · Views: 323
Top