tablemountain
Member
- Messages
- 79
- Likes
- 1
Yesterday saudia arabia announced it had an increase in supply, short term drop in price, spiked down quickly and stopped me out (look at positive, made a few $$ and didn't loose anything).
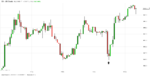
Daily: still looks bullish to me, I need to get back in long
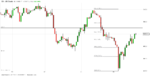
1hr chart: when price did drop it came right back down the to the price area I bought at, on 1 chart it looked like (if I am right) an inverted H&S. I should have seen this and got back in, but after hearing the news I thought prices would go even further down. Lesson, don't trade news, trade price action, daily showed bullish, 5 min entry: price action showed entry for long.
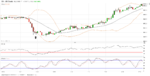
5 min entry: I had many factors to back up a long here, daily showed bullish, 1 hr chart showed previous price area for long and 5 min chart was great for entry, candle bar outside of bollinger and RSI & Stoch on their extremes.
If i entered it would have climbed back to where I was and today its even higher!
Still looking to get back in long, looking at 49.60 as a level.
Daily: still looks bullish to me, I need to get back in long
1hr chart: when price did drop it came right back down the to the price area I bought at, on 1 chart it looked like (if I am right) an inverted H&S. I should have seen this and got back in, but after hearing the news I thought prices would go even further down. Lesson, don't trade news, trade price action, daily showed bullish, 5 min entry: price action showed entry for long.
5 min entry: I had many factors to back up a long here, daily showed bullish, 1 hr chart showed previous price area for long and 5 min chart was great for entry, candle bar outside of bollinger and RSI & Stoch on their extremes.
If i entered it would have climbed back to where I was and today its even higher!
Still looking to get back in long, looking at 49.60 as a level.