In my view, we are still in a secular bear market and at a point of high risk. However, we are now in the seasonally strong time for the year - a time when spirits are high and the market performs better than at any other time on a historic basis. A study in the December 2002 issue of the American Economic Review reported that the average stock market returns from Halloween through May Day (the so-called "winter" months) were significantly higher than equity returns from May Day through Halloween (the "summer months"). The findings were that the summer months' returns have averaged so much less than those of the winter months that almost all of the stock market's long-term returns have been produced during the winter months. The obvious implication is that simply going to cash between May Day and Halloween will have only minor impact on long-term returns while dramatically reducing risk.
I haven't written a Special Alert in quite awhile and have been getting calls and e-mails asking why I haven't written one and in general, I write an Alert when:
1) I feel I have something worthwhile to share, and
2) I have the time to write it.
Apparently, neither has been the case. Actually, I had collected a good deal of information that I was going to use at various times when I "almost" wrote an Alert. Something held me back each time. As I think about it, the reason is very clear. Over a year ago, I wrote that I expected the market to bottom soon (this was before the March 2009 low) and that we should see a "reprieve rally" that draws everyone back into the market. That has, of course, happened. Since this cycle is much longer than its predecessor, the rally has lasted longer than I had initially expected. In addition, I was biased because I am aware of the sequence of events in the cycle and know that the next phases are incredibly negative - deflation, bankruptcies & liquidation and debt default. You've heard it before and I have been harping on this for quite awhile. The point is I don't want everyone to get too bullish and lose sight of what is really going on.
I have kept the danger sign up even through this rally phase because I know that the majority has become bullish and feel "the worst is over". I would like that to be the case, but that is similar to believing you won't have winter because you hate cold weather. This is a cycle and it will go through each step and each phase just like all of its predecessors. I think we are getting to a point in the short term where we may have had a little bit too much of a good thing.
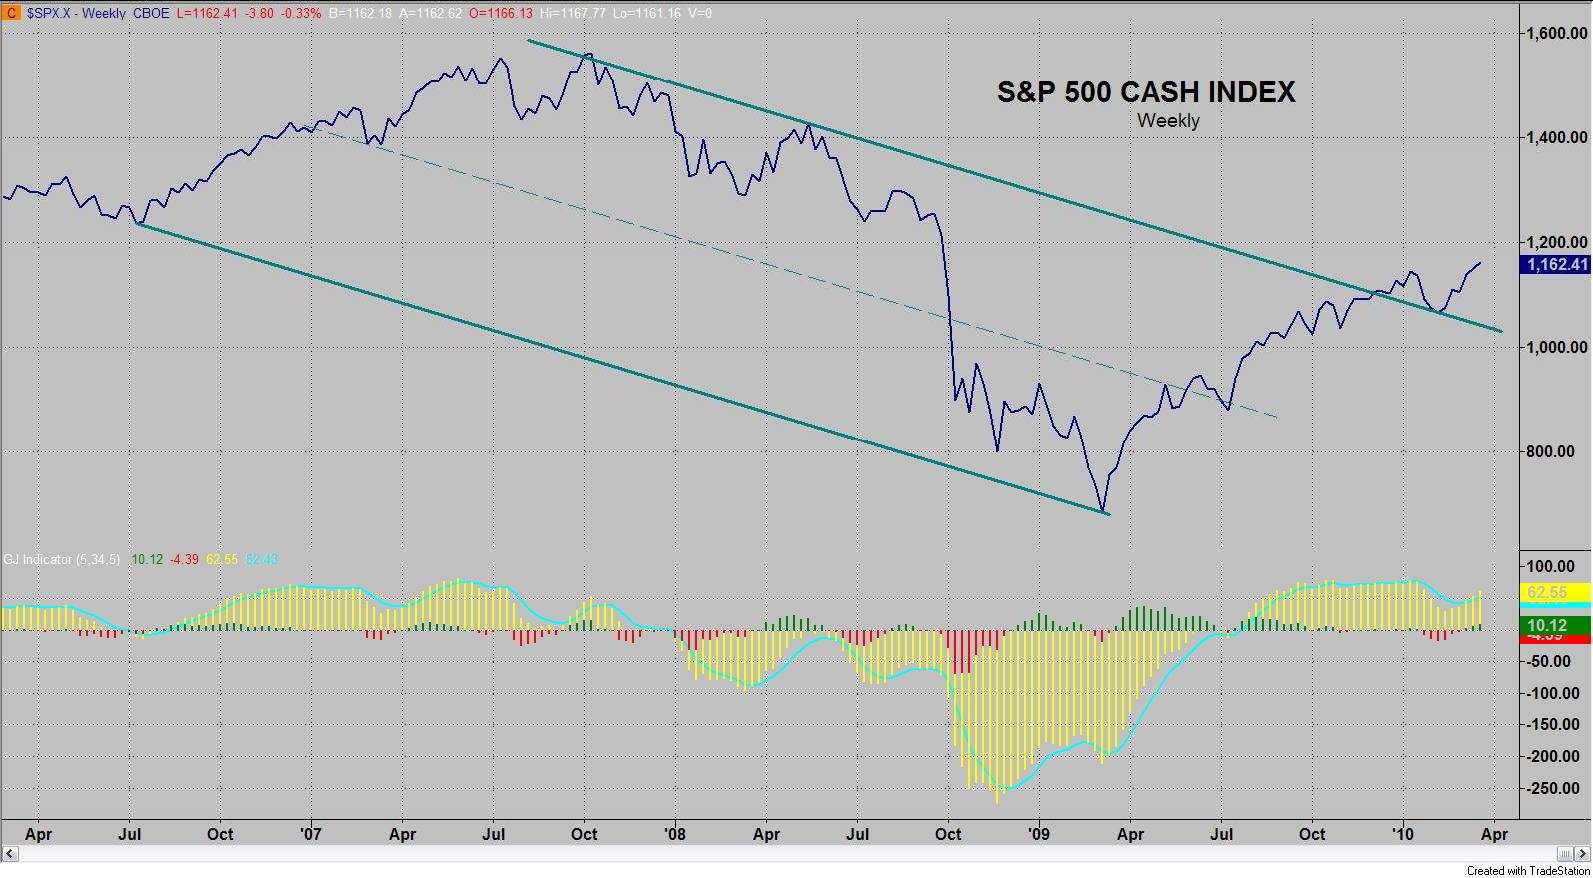
The above chart is bullish - period. If you didn't have a bias, then that's the message. From the March 2009 low the market has traversed from the bottom of the channel all the way to the top - once there, it hardly hesitated and broke out. That's bullish. It then retraced to the top of the channel and turned back up. That's bullish, too. When I last idscussed this I stated that I had a projection to 1172. I stated that if the market were able to break through the 1172 level then I had projections to between 1233 and 1245. I mentioned that my next minor turn date was December 20th and the next date was January 5th. December 20th was a Sunday - the prior trading day was Friday, December 18 which was a low. January 5th was not the top, but definitely couldn't have been a bad time to sell as the market only went 1.2% higher on a closing basis over the next few trading days. In fact, the market traded below the close of January 5th in six out of the following eight days and then fell over 105 points from the peak in only 13 trading days. So, those two
trading dates did their job.
Here is what I said specifically in last time "In summary, the market still has a great deal more downside risk than upside potential, but the seasonality is bullish as is the near term price action. If the market moves higher, it will be a very clear breakout on the chart which could cause short covering and potentially additional buying. My next minor turn date is December 20th and the next date is about January 5th. That second date could prove interesting due to the "January Effect". It is believed that if January stock prices are up, the year will be positive - particular attention is given to the first week of January. If the typical seasonality plays out, the market should advance into the January 5th date."
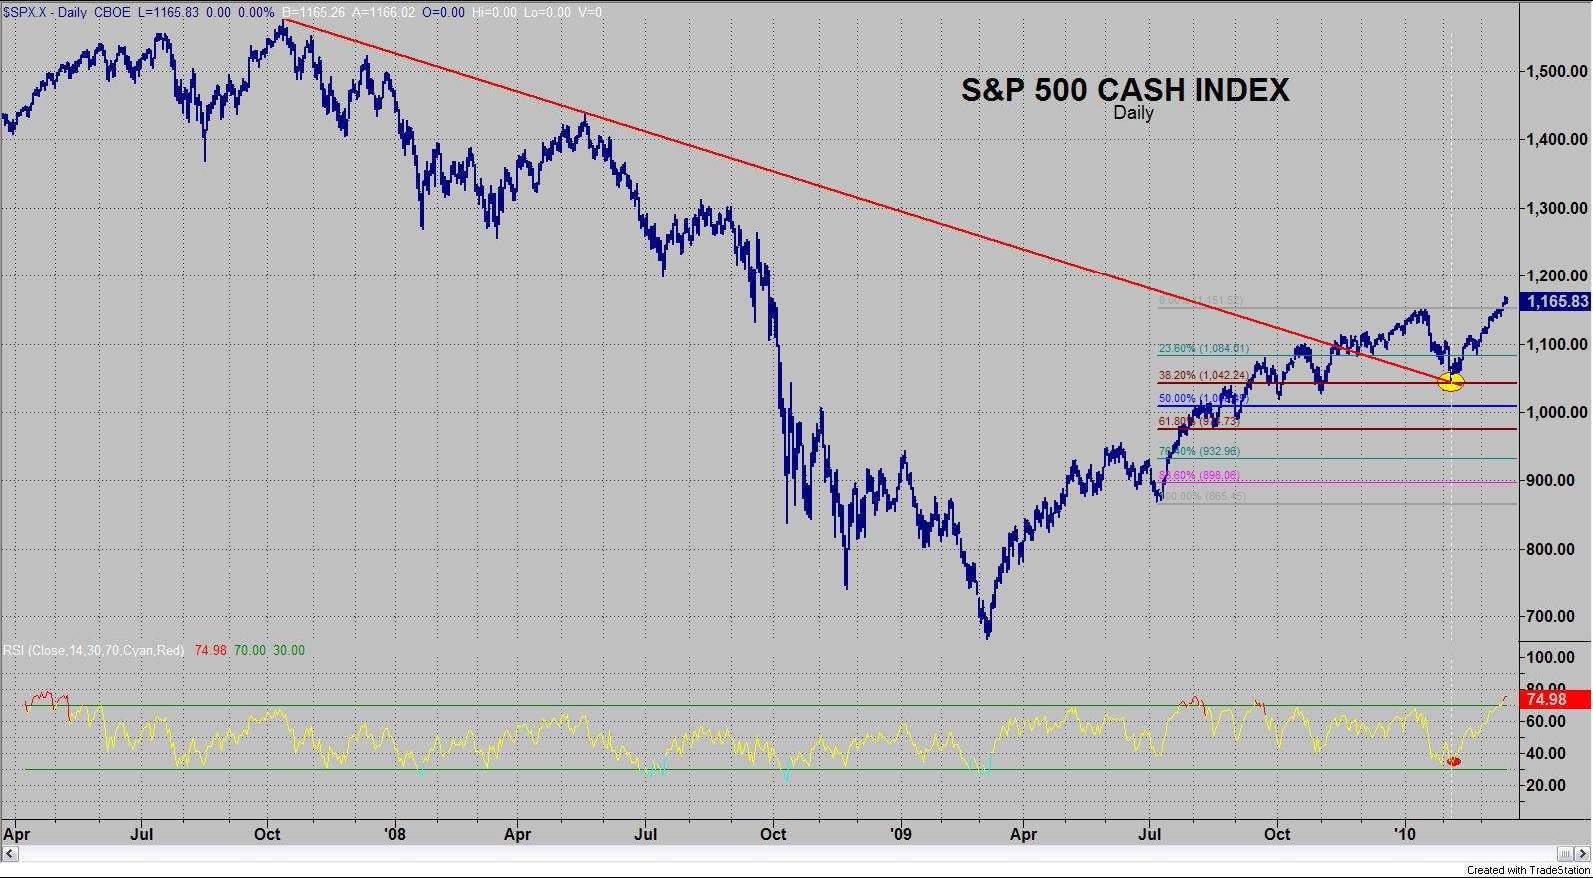
The low was hit on February 5th and they may as well have advertised it in the newspaper. The trend line from the top in October 2007 through the May 2008 top had been broken on the upside and the market pulled back to touch the trend line and the 38.2% Fibonacci correction from the July 8, 2009 low. The low was made where the two lines intersected (see yellow circle in chart above). Does it get any more perfect than that? The relative strength index below confirmed that low with a divergence. That's worthy of a chapter - or, at the very least, a couple of pages in a text book on technical analysis. Note that the market came back and made a higher high confirming its bullishness.
The leadership in the market has been the NASDAQ, the Semiconductor Index, and the Russell 2000. Without wasting a lot of words, let's just look at the charts:
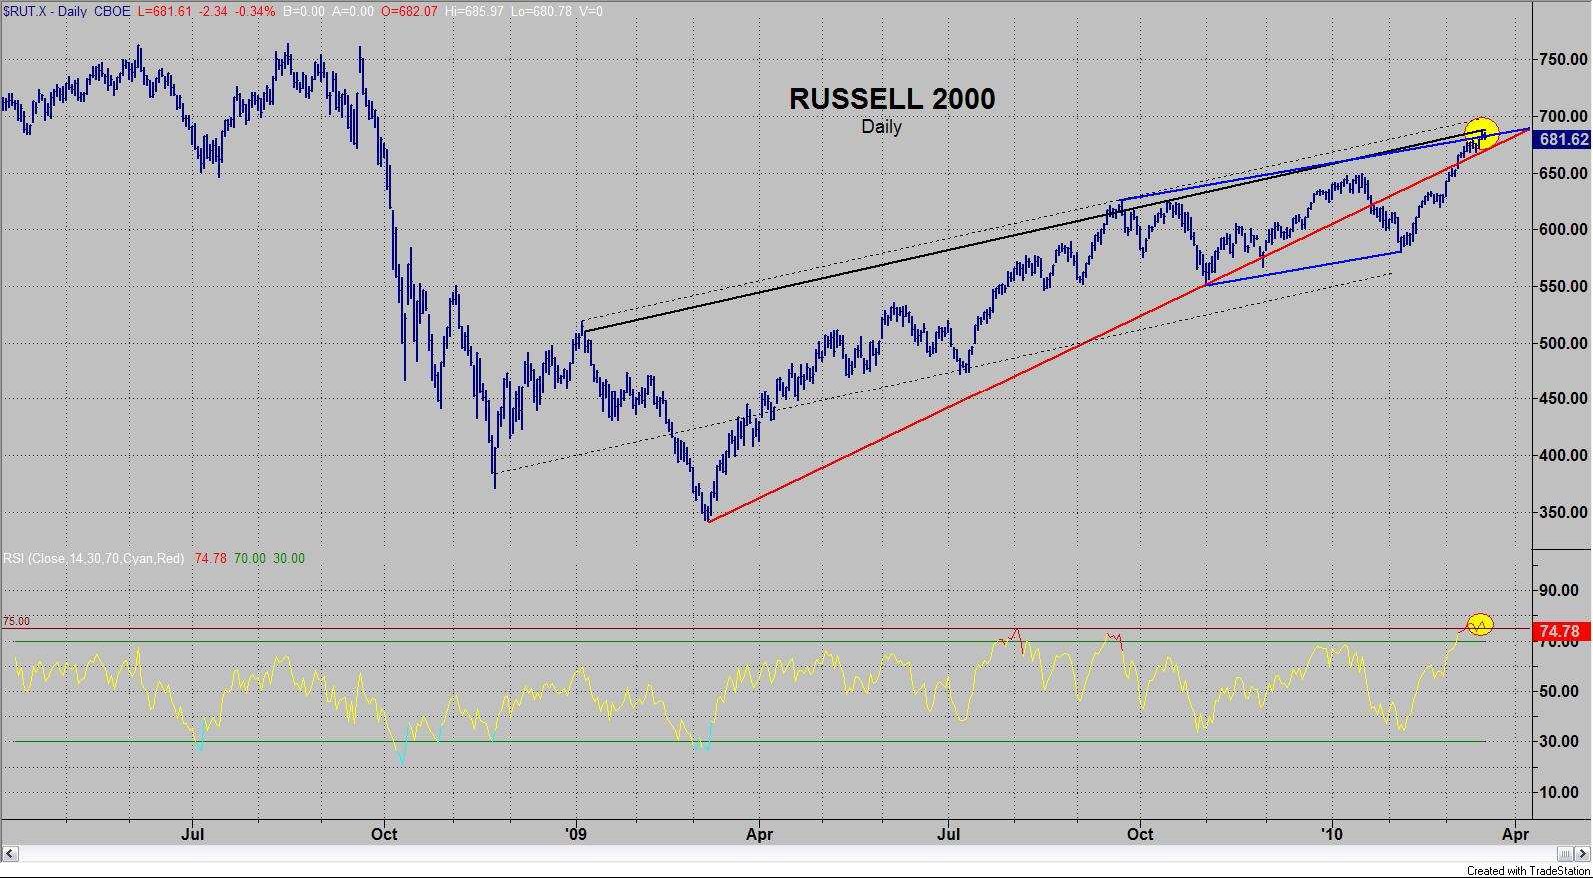
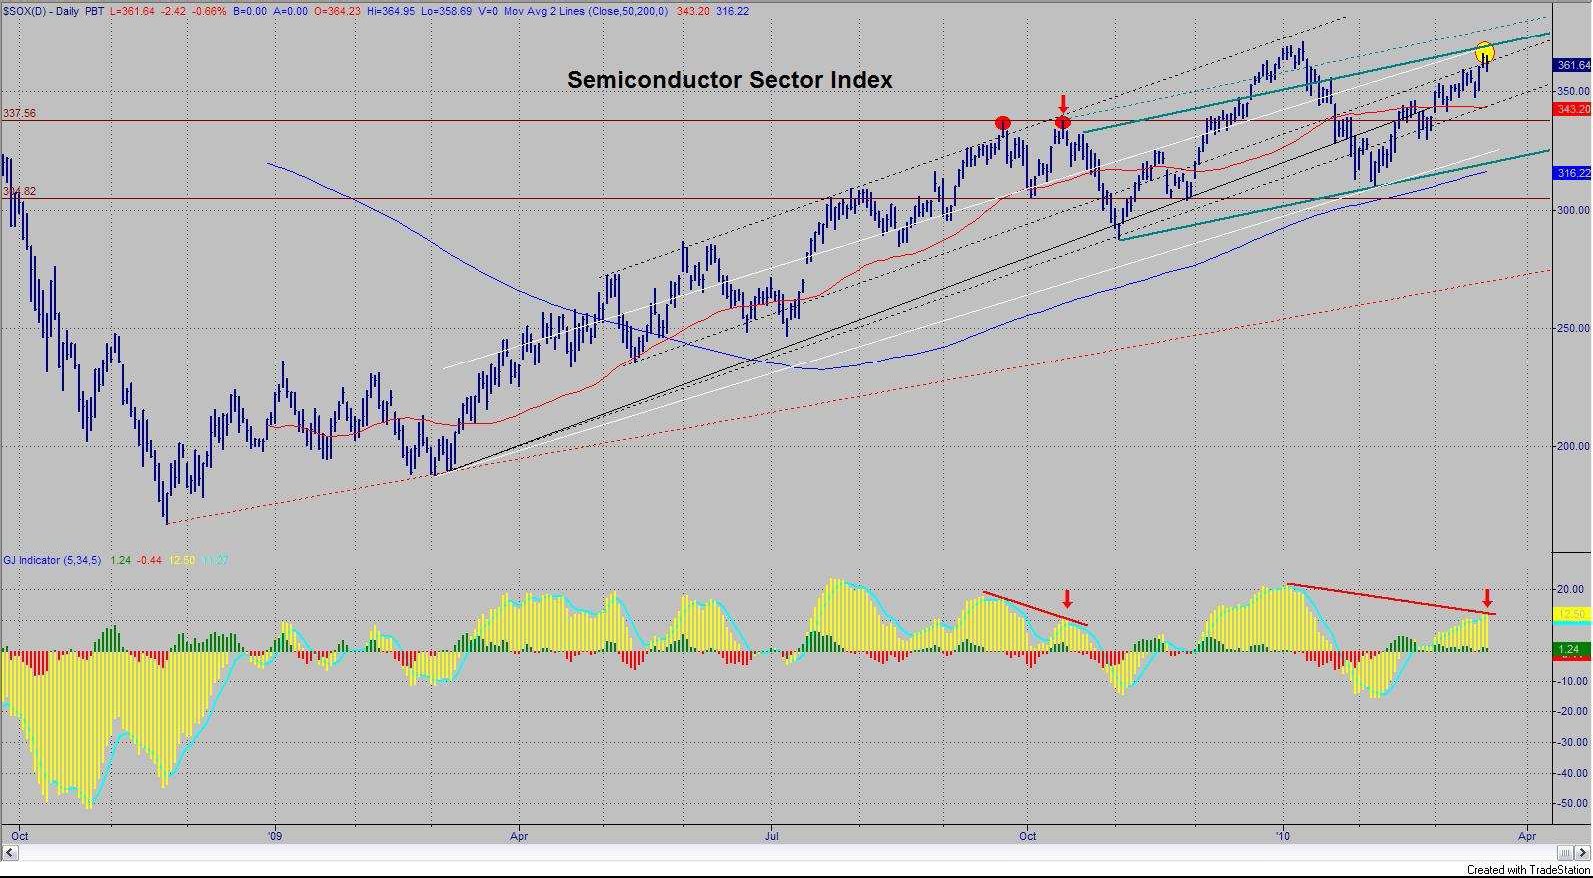
The Russell 2000 has moved to the upper channel line and the black tops line. The relative strength line is now red and in overbought territory. There is divergence on my indicator from one week ago. This market could overshoot to the dotted line, but I think that would be unlikely. Now, let's look at the semiconductor index. It has been a good leader throughout this move, but it can't seem to even make a new high. If you notice, it was the semiconductor index that signaled and confirmed the bottom back in March of last year. The semiconductor index didn't bottom in March (like everything else), it bottomed in November with a divergent low .... and then made a higher low in March 5 diverging with the other indices. Whether you like it or not, that's serious leadership. Is it now leading to the downside?
I don't necessarily think that this expected top will be "the" top because there has been a great deal of momentum in this rally and because these "reprieve rallies" are exceptionally effective in drawing everyone into the party. That means that after a reasonable correction, I wouldn't be at all
surprised to see this market return to the upside and press for an even higher recovery high. A rally into May wouldn't surprise me at all. In fact, I have had an August date that is the most notable date for this entire year.
I had assumed that it would be a low, but the way this market is going, it wouldn't surprise me if it turned out to be a high. Please don't misconstrue my underlying bullishness as anything more than that. I have the DANGER sign on and I have it on for darn good reason. I don't believe for one minute that "the worst is behind us" as the Administration and the financial news media would have us believe. I think when this bull run finishes horsing around with us, the long lost memory of the bear market of just one year ago will return in spades. In my view, before this is all over, I believe what is coming will make the bear market we just left look like a relatively nice time by comparison. So let's try to keep that cheery thought in mind. Hopefully, I am wrong - but you don't want to be skipping through the tulips with your rose colored glasses on if I am not wrong.
There are some reasons other than momentum that could allow this market to move higher for awhile. I have been focusing on the "big picture" with the implications of the Long Wave cycle, debt, deficits, derivatives, etc. To be sure, these factors dictate the economic "big picture", but we are in a
countertrend rally within that big picture and the focus is elsewhere for the moment. Corporate cash flow is on the rise and estimates are for the S&P companies to earn $95.64 in 2011 for a forward P/E ratio of 13.5. Forward earnings have now risen for 43 consecutive weeks. Bond mutual funds have a huge amount of money and very large speculators are very bearish on the S&P. In fact, these speculators have net short positions larger than in late 2003 and early 2004. They are more bearish than in the summer of 2007 when two of Bear Stearns hedge funds blew up, when AIG and Lehman imploded in September 2008 and when bank stocks plunged in 2009. These were Ed Yardeni's observations and the significance is that it is a lot of money that could potentially go into the stock market - particularly if it doesn't get bearish pretty soon.
As usual, one can always find information to promote whatever viewpoint the person favors. The information in the last paragraph is potentially bullish ... although, it doesn't provide quality leadership or pay down the debt or eliminate the deficits or shrink the derivatives exposure. Nonetheless, it occasionally pays to be aware of such things if they are of a large enough magnitude to make a difference. Regardless of which information you may be reading, it is fairly obvious that people are coming back into the stock market. The latest survey from NAAIM (The National Association of Active Investment Managers) shown below. The chart shows a spike unlike any seen in the past couple of years. The median exposure of managers is currently 95% long which is the highest since the week of October 17, 2007.
Further, the reading is up from 50% net long just two weeks ago and only 30% net long near the February low. These people decreased their investment exposure during the bear market and have steadily increased it during the bull phase. The whole point is that we have now moved to an extreme that implies that things may be overdone for the short term and that further upside action is likely to be tempered.
In summary, the market has finally become overbought, frothy and has set up some divergences. The leadership is the key - the Russell made a higher high on a very strong rally that was not confirmed by the semiconductor index, which has been the leader. Normally, one would expect a top and, at least, a worthwhile correction. The trend lines on the Russell and the Semiconductor Index are excellent "lines in the sand" i.e. if, for some reason, the market moves above those lines, then it still has higher to go and you'll want to get out of the way. Otherwise, we should have our correction... which might just set up another place to go long. I believe the market still has more participants to
attract before it takes them on another "E Ticket" ride to the downside.
Note: I think it is important to get into the mode of being a seller when the opportunity presents itself. The market has rallied for a year and, once again, investors are being lulled into complacency. One would think that with the collapse after 2000 and particularly with the decline we experienced just over a year ago that investors would learn ... and remember - but they don't. That's the power of the Long Wave cycle and human nature.
Garrett Jones can be contacted by Email
I haven't written a Special Alert in quite awhile and have been getting calls and e-mails asking why I haven't written one and in general, I write an Alert when:
1) I feel I have something worthwhile to share, and
2) I have the time to write it.
Apparently, neither has been the case. Actually, I had collected a good deal of information that I was going to use at various times when I "almost" wrote an Alert. Something held me back each time. As I think about it, the reason is very clear. Over a year ago, I wrote that I expected the market to bottom soon (this was before the March 2009 low) and that we should see a "reprieve rally" that draws everyone back into the market. That has, of course, happened. Since this cycle is much longer than its predecessor, the rally has lasted longer than I had initially expected. In addition, I was biased because I am aware of the sequence of events in the cycle and know that the next phases are incredibly negative - deflation, bankruptcies & liquidation and debt default. You've heard it before and I have been harping on this for quite awhile. The point is I don't want everyone to get too bullish and lose sight of what is really going on.
I have kept the danger sign up even through this rally phase because I know that the majority has become bullish and feel "the worst is over". I would like that to be the case, but that is similar to believing you won't have winter because you hate cold weather. This is a cycle and it will go through each step and each phase just like all of its predecessors. I think we are getting to a point in the short term where we may have had a little bit too much of a good thing.
The above chart is bullish - period. If you didn't have a bias, then that's the message. From the March 2009 low the market has traversed from the bottom of the channel all the way to the top - once there, it hardly hesitated and broke out. That's bullish. It then retraced to the top of the channel and turned back up. That's bullish, too. When I last idscussed this I stated that I had a projection to 1172. I stated that if the market were able to break through the 1172 level then I had projections to between 1233 and 1245. I mentioned that my next minor turn date was December 20th and the next date was January 5th. December 20th was a Sunday - the prior trading day was Friday, December 18 which was a low. January 5th was not the top, but definitely couldn't have been a bad time to sell as the market only went 1.2% higher on a closing basis over the next few trading days. In fact, the market traded below the close of January 5th in six out of the following eight days and then fell over 105 points from the peak in only 13 trading days. So, those two
trading dates did their job.
Here is what I said specifically in last time "In summary, the market still has a great deal more downside risk than upside potential, but the seasonality is bullish as is the near term price action. If the market moves higher, it will be a very clear breakout on the chart which could cause short covering and potentially additional buying. My next minor turn date is December 20th and the next date is about January 5th. That second date could prove interesting due to the "January Effect". It is believed that if January stock prices are up, the year will be positive - particular attention is given to the first week of January. If the typical seasonality plays out, the market should advance into the January 5th date."
The low was hit on February 5th and they may as well have advertised it in the newspaper. The trend line from the top in October 2007 through the May 2008 top had been broken on the upside and the market pulled back to touch the trend line and the 38.2% Fibonacci correction from the July 8, 2009 low. The low was made where the two lines intersected (see yellow circle in chart above). Does it get any more perfect than that? The relative strength index below confirmed that low with a divergence. That's worthy of a chapter - or, at the very least, a couple of pages in a text book on technical analysis. Note that the market came back and made a higher high confirming its bullishness.
The leadership in the market has been the NASDAQ, the Semiconductor Index, and the Russell 2000. Without wasting a lot of words, let's just look at the charts:
The Russell 2000 has moved to the upper channel line and the black tops line. The relative strength line is now red and in overbought territory. There is divergence on my indicator from one week ago. This market could overshoot to the dotted line, but I think that would be unlikely. Now, let's look at the semiconductor index. It has been a good leader throughout this move, but it can't seem to even make a new high. If you notice, it was the semiconductor index that signaled and confirmed the bottom back in March of last year. The semiconductor index didn't bottom in March (like everything else), it bottomed in November with a divergent low .... and then made a higher low in March 5 diverging with the other indices. Whether you like it or not, that's serious leadership. Is it now leading to the downside?
I don't necessarily think that this expected top will be "the" top because there has been a great deal of momentum in this rally and because these "reprieve rallies" are exceptionally effective in drawing everyone into the party. That means that after a reasonable correction, I wouldn't be at all
surprised to see this market return to the upside and press for an even higher recovery high. A rally into May wouldn't surprise me at all. In fact, I have had an August date that is the most notable date for this entire year.
I had assumed that it would be a low, but the way this market is going, it wouldn't surprise me if it turned out to be a high. Please don't misconstrue my underlying bullishness as anything more than that. I have the DANGER sign on and I have it on for darn good reason. I don't believe for one minute that "the worst is behind us" as the Administration and the financial news media would have us believe. I think when this bull run finishes horsing around with us, the long lost memory of the bear market of just one year ago will return in spades. In my view, before this is all over, I believe what is coming will make the bear market we just left look like a relatively nice time by comparison. So let's try to keep that cheery thought in mind. Hopefully, I am wrong - but you don't want to be skipping through the tulips with your rose colored glasses on if I am not wrong.
There are some reasons other than momentum that could allow this market to move higher for awhile. I have been focusing on the "big picture" with the implications of the Long Wave cycle, debt, deficits, derivatives, etc. To be sure, these factors dictate the economic "big picture", but we are in a
countertrend rally within that big picture and the focus is elsewhere for the moment. Corporate cash flow is on the rise and estimates are for the S&P companies to earn $95.64 in 2011 for a forward P/E ratio of 13.5. Forward earnings have now risen for 43 consecutive weeks. Bond mutual funds have a huge amount of money and very large speculators are very bearish on the S&P. In fact, these speculators have net short positions larger than in late 2003 and early 2004. They are more bearish than in the summer of 2007 when two of Bear Stearns hedge funds blew up, when AIG and Lehman imploded in September 2008 and when bank stocks plunged in 2009. These were Ed Yardeni's observations and the significance is that it is a lot of money that could potentially go into the stock market - particularly if it doesn't get bearish pretty soon.
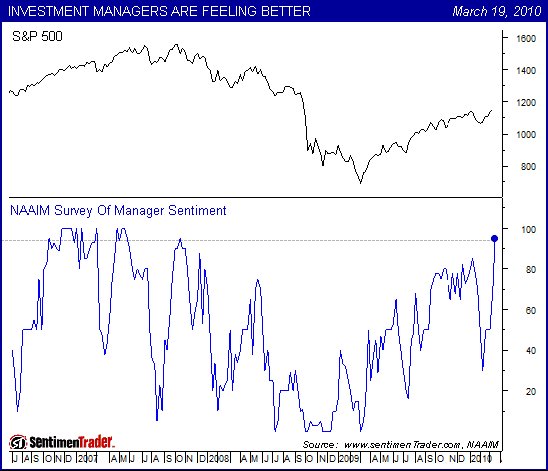
As usual, one can always find information to promote whatever viewpoint the person favors. The information in the last paragraph is potentially bullish ... although, it doesn't provide quality leadership or pay down the debt or eliminate the deficits or shrink the derivatives exposure. Nonetheless, it occasionally pays to be aware of such things if they are of a large enough magnitude to make a difference. Regardless of which information you may be reading, it is fairly obvious that people are coming back into the stock market. The latest survey from NAAIM (The National Association of Active Investment Managers) shown below. The chart shows a spike unlike any seen in the past couple of years. The median exposure of managers is currently 95% long which is the highest since the week of October 17, 2007.
Further, the reading is up from 50% net long just two weeks ago and only 30% net long near the February low. These people decreased their investment exposure during the bear market and have steadily increased it during the bull phase. The whole point is that we have now moved to an extreme that implies that things may be overdone for the short term and that further upside action is likely to be tempered.
In summary, the market has finally become overbought, frothy and has set up some divergences. The leadership is the key - the Russell made a higher high on a very strong rally that was not confirmed by the semiconductor index, which has been the leader. Normally, one would expect a top and, at least, a worthwhile correction. The trend lines on the Russell and the Semiconductor Index are excellent "lines in the sand" i.e. if, for some reason, the market moves above those lines, then it still has higher to go and you'll want to get out of the way. Otherwise, we should have our correction... which might just set up another place to go long. I believe the market still has more participants to
attract before it takes them on another "E Ticket" ride to the downside.
Note: I think it is important to get into the mode of being a seller when the opportunity presents itself. The market has rallied for a year and, once again, investors are being lulled into complacency. One would think that with the collapse after 2000 and particularly with the decline we experienced just over a year ago that investors would learn ... and remember - but they don't. That's the power of the Long Wave cycle and human nature.
Garrett Jones can be contacted by Email
Last edited by a moderator: