Christiaan
Active member
- Messages
- 227
- Likes
- 10
Hello guys
I got this indicator for free cannot remember where.I'm sure that it is not copyright infringement because i cannot find a site where you can buy the indicator.I think it is a free indicator.Will sent a e-mail to the creator and if he says that it is a free indicator then i will give it to anybody who is intrested having received the creator's blessing ofcourse.
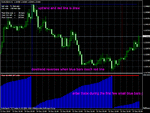
Unfornanately i did not get a manual but there are a few instructions if you can call them that on the site that gives it away for free.From these instructions i manage to draw the followring conclusions and will like to get your input.It's called the float indicator.I guess that it's like o oscillator showing overbought and oversold.But this is something diffrent i believe.What it does is it uses past data to try to predict where a trend will become exausted and also when a new trend is beginning.None of this will make sense so let get right to the chart shall we.
Slighty cut of to your right you get a uprend.This is where the indictor draws a red line and start to draw the blue bars from scrath.I guess that it can serve as confirmation for any signals during those first few small bars where the previos trend ended and a new one is beginning to form.Here it get's intresting you can see that at the next downtrend that the downtrend ended when the blue bars reached the red line calculated by using the past trend's data.Then that downtrend switfly reversed and a nice uptrend has already taken shape.Buying now might be a good idea.
This is how i believe the system works from the few instructions i remembered from the site i downloaded it for free but cannot find again.Tell me what you think

