Head & shoulders ftse100

gkareer

Junior member
Messages
18
Likes
0
sorry this is correct chart
 

Attachments

  • updatachart.jpg
    updatachart.jpg
    445.7 KB · Views: 446
Nice chart. A couple of questions:-

Were you looking for the 12 point target or do you look at this pattern as a start of a new trend?

Where do you place your stop?
 
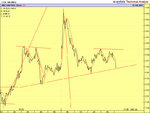
I placed my stop above the shoulder at 4140, just been stopped out.
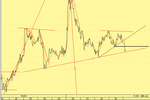
Yes i did think it was th start of new down trend.
My moving avergaes also gave a sell signal & 14 CCI also was heading south through 0, on my 5min chart!!
Lost 8 points could of made 20-40!!!

thanks for looking at my charts bigbusiness

cheers

sonny
 
I'm new to trading so just learning a thing or two.

Do you think i put my stop to close, do u think it would be better placed just about Head at 4146.

I just think if i've been stopped out too soon, shall see

sonny
 
hmm
not my favourite patterm.
I suspect more of them abort than succeed and
that is why they stand out so well
when they do succeed , if you see what I mean.

I guess the problem might be they only work at tops and we
havent topped out yet ?
so when the pattern aborts you should stop and reverse ?
 
you didnt say where you went short.

if the pattern is too succeed it must break the neckline.
so if it breaks back above it , it has failed ?
should your stop not be at the neckline or 1 or 2 pts above it ?

I have drawn 2 lines on your chart but I think the horizontal one
is where I might have put my stop.

anyone else got any thoughts ?
 

Attachments

  • hs.gif
    hs.gif
    14.9 KB · Views: 403
I prefer the head & shoulders to form over a longer period of time and to have a higher target price. They are supposed to be quite reliable and the stop is small enough if there is a chance of a reversal.

Good luck with the next one sonny.
 
Hi Bonsai

Several T/A authorities (incl TBS) seem to favour a stop level above the right shoulder, alas it doesn't seem to make much difference for me as mine invariably fail.
 
havent traded Head and shoulders patterns since ftse went
over to sets.
they were more reliable under the old jobber system. imo
 
I have seen a few stats. about head and shoulders but it would be interesting to know how accurate they are on a 1min chart. They seem to meet their target from the top of the head reasonably often but how often do they signal the end of a trend?

Does the inverse h&s work better? I will have a look at some charts when I get some time.
 
Top