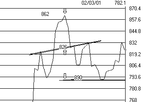
The chart attached shows the classic head and shoulders top from the current Bank of Scotland BSCT.
To calculate the drop, take the head (862) and draw a perpendicular line to cross the shoulders.Take that crossing value(826) and take it away from the head value(862). This equals 36. The drop will be 36 from 826 = 790.
It's no fluke that the price bounces right on 790.
This is followed( unusually) by a head and shoulders bottom , leading to a target rise to 824, finally making resistance at 832 before dropping again.
It's hard to say where this is going, but my feeling is the chart is at support on a longterm rising trend from the end of Feb 2000 ( ignore the big glitch from March to end of April 2001, all the banks did the same)

