You are using an out of date browser. It may not display this or other websites correctly.
You should upgrade or use an alternative browser.
You should upgrade or use an alternative browser.
Have you ventured to the dark side yet?
- Thread starter wannagetstacked
- Start date
- Watchers 45
wannagetstacked
Well-known member
- Messages
- 287
- Likes
- 11
The way to avoid the problems you outlined can be helped by knowing inside out the market you are trading.
The trades i posted do not have to be viewed as an "always in" strategy. Viewing the the whole trading day as if you were always in will help however, this will mean your trades would always happen under the same circumstances, these being when pressure changes from buying to selling and vice versa.
Your trading plan should also include a general time plan for the day, this includes knowing the times of day that indecision are likely to occur.
Another feature of your trading plan should be an analysis of when a trade is too risky to take using the "almost always in" method. This should ideally be based on price action and not just a monetary value. Including knowing where areas of strong S/R may occur again, and then calculating whether the initial risk of the trade is likely to result in a 1:1 reward or greater, and therefore whether it is worth the risk.
As for bases, it is rare to find prolonged bases that result in consecutive losses of your initial maximum risk, this is because the trailing stop will usually allow you to exit for a much smaller loss than your initial risk. Again avoiding bases due to lack of pressure only and not through accumulation can be helped with a time plan of the day.
Another way of minimizing losses during bases is to simply leave the market when you realise what is happening, then wait for the base to break out, and resume trading from an appropriate point, taking the same trade you would if you had been always in during the base.
Finer points of loss minimization come through contract management.
It is hard to explain some of the finer points of this strategy as they are personal trade filters that would be of no use to another trader.
The individual user has to develop the method around their own instrument, which will also help them gain a feel for the trading conditions at any time of day.
Sorry if that makes a complete lack of sense.
Even if this strategy turns out to not be right for you, the in market study needed to develop rules will be invaluable.
Nathan
wannagetstacked
Well-known member
- Messages
- 287
- Likes
- 11
Sorry I haven't posted recently. There are some great things coming along in the PV forum,
All the Wyckoff devotees may enjoy this site, lots of archived examples for the past 4 years.
http://www.ltg-trading.com/past archives.htm
All the Wyckoff devotees may enjoy this site, lots of archived examples for the past 4 years.
http://www.ltg-trading.com/past archives.htm
wannagetstacked said:It is my guess that only around 2-5% of T2W members will post on this thread.
All i ask is you leave a post saying whether you are a convert or not.
If 5 % of members do post it will be interesting as it is a percentage mirrored by the average failure rate of 95% for new traders. Coincidence?...........
.Thanks
Nathan
Considering that this thread only started at the beginning of December, it's going well. I have been convinced that indicators are useless as entry signals for a long time and, currently, use only bar charts and some averages (which are the same as momentum indicators) to tell me what trend I am in.
Since you mention the 95% failure rate for traders, a superstitious niggle at the back of my head tells me that I had better post..... 🙂
Split
TheBramble said:A PUP is a "Power Up Tick" - a term coined by Jea Yu and Russell Lockhart (underground trader).
"It's a formation triggered during an inactive uptrend as the 5MA flattens out while the 15MA continues to rise".
It's based on a combination of MA and Stochastics which are, er, indicators 😱
This thread has taken a strange twist. How about "No Indicators - Reversed"?
Here we go! Complications!! 🙁 🙁
Split
wannagetstacked
Well-known member
- Messages
- 287
- Likes
- 11
I rarely trade on a thursday but found this accumulation irresistable.
Eur/Usd in a tight 2 hour range, should have a lot of force behind it when it pops, perferably take the trade short at around 1.2781.
Shouldn't be long before it does go, possibly after lunch.
Here's the chart.
Nathan
Eur/Usd in a tight 2 hour range, should have a lot of force behind it when it pops, perferably take the trade short at around 1.2781.
Shouldn't be long before it does go, possibly after lunch.
Here's the chart.
Nathan
Attachments
wannagetstacked
Well-known member
- Messages
- 287
- Likes
- 11
Finally popped now as I expected after the lunchtime period.
A nice move worth 40 pips. The bearish signals were present and was worth the wait. I am going to remain bearish now until signalled otherwise.
Will post charts in a while.
Nathan
A nice move worth 40 pips. The bearish signals were present and was worth the wait. I am going to remain bearish now until signalled otherwise.
Will post charts in a while.
Nathan
wannagetstacked
Well-known member
- Messages
- 287
- Likes
- 11

wannagetstacked
Well-known member
- Messages
- 287
- Likes
- 11
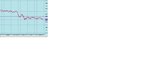
Further update on yesterdays eur/usd action.
When using an always in strategy as previously outlined days like this can be very rewarding.
Stop is trailed 2 pips above the last swing high in a downtrend, swing low in an uptrend. Make sure to only trail the stop above the swing high after a swing low is broken in a downtrend, vice versa for an uptrend, this small filter helps to avoid trading during consolidatory periods as you only trail the stop when it has broken out.
This all sounds a little confusing so here is a chart to show yesterdays eur/usd action.
Nathan
Attachments

wannagetstacked
Well-known member
- Messages
- 287
- Likes
- 11
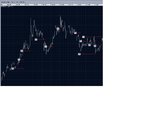
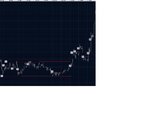
Another price only example for those still following my thread. The following two graphs are my trades for today. The lines on the graph were places where I felt if prices passed through pressures had changed, and where I therefore changed my position from buy to sell, obviously following an "always in" method again.
Lots of scratch trades during the lunchtime hours where I didn't trade, I've put these in anyway to demonstrate how consolidations don't have to mean losses, more often than not usually just break even trades.
Its best to view the charts as my journey for today, follow the bars from left to right and see if you would have changed from buy to sell in different places. Using support, resistance, and simple 123 formations to determine whether you are a buyer or seller. As you go along make a simple time plan to decide the best times to trade
There are no risk:reward ratios and no immediate stops(emergency stops are fine). Basically no restrictions.
Let your instrument tell you its story and just enjoy the ride wherever it may take you
Don't overcomplicate trading, remember just KISS.
These are 30 second eur/usd charts. Starting roughly around 8.30 am.
Hope these help someone.
Nathan
Attachments
wannagetstacked
Well-known member
- Messages
- 287
- Likes
- 11
Ignore the numbers on the lines, I need to work out how to turn them off as they just get in the way.
30 second charts are near identical to one minute charts when zoomed out, they help to show up areas of possible support and resistance before everybody else has them confirmed on 1 minute charts. I will often use 10 second charts also(zoomed out). As long as you're not trading candlestick patterns the 10 second, 30 second, and 1 minute charts produce similar results. The advantage of 10 and 30 second charts are that they will show how a 1 minute spike is formed, it may appear to have occured intantaneously on 1 min bars when in fact it was accumulated over steadily on 10 second bars. Its really a matter of personal preference, I do like the advantage of really seeing what forms certain 1 minute bars though. Another example would be a level of resistance that is touched 3-4 times on 1 minute bars, 10 second charts may show that it was actually touched many times more than this.
Knowledge is power etc etc, but don't get too bogged down in the nitty gritty of 10 second charts and start overanalysing them.
Thanks for your responses guys, its nice to know i'm not talking to myself.
Nathan
wannagetstacked
Well-known member
- Messages
- 287
- Likes
- 11
Another update for todays action, as usual its not the greatest day, thursdays are sometimes very flat, a few scratch trades and a loss, prices stuck in a 30 pip range for the past 4 hours but still tradeable, no trend so far, if i had to make a guess i would say the next few hours would be bullish. Possible resistance for bulls at the swing point at price 1.3076.
Managed to squeeze out 32 pips so far.
Charts to follow following same methods are previously outlined, i.e: wait for the 123 to break out before raising your stop.
Red lines long, green lines short, blue lines are how the stop was moved.
Nathan
Managed to squeeze out 32 pips so far.
Charts to follow following same methods are previously outlined, i.e: wait for the 123 to break out before raising your stop.
Red lines long, green lines short, blue lines are how the stop was moved.
Nathan
Attachments


wannagetstacked
Well-known member
- Messages
- 287
- Likes
- 11
Also, max initial risk on any trade so far has been 8 pips.
One or two trades had initial risk of 4-5 pips, stakes are raised on these trades to reflect the lowered maximum loss
One or two trades had initial risk of 4-5 pips, stakes are raised on these trades to reflect the lowered maximum loss
wannagetstacked
Well-known member
- Messages
- 287
- Likes
- 11

wannagetstacked
Well-known member
- Messages
- 287
- Likes
- 11
Just wondering if anyone else viewing my thread is trading in a similar way?
If so, how are you finding it.
I've tried to cover all the details and it would be great to hear that someone had benefited from my examples.
The thread has had over 10000 views now which is great. Maybe a few indicator converts are viewing?
Nathan
If so, how are you finding it.
I've tried to cover all the details and it would be great to hear that someone had benefited from my examples.
The thread has had over 10000 views now which is great. Maybe a few indicator converts are viewing?
Nathan
Similar threads
- Replies
- 71
- Views
- 13K
L
- Replies
- 0
- Views
- 3K
- Replies
- 1
- Views
- 5K