Has the market bottomed for QBTS for now?

  • Thread starter Thread starter HB123
  • Start date Start date
  • Watchers Watchers 4

HB123

Junior member
Messages
33
Likes
2
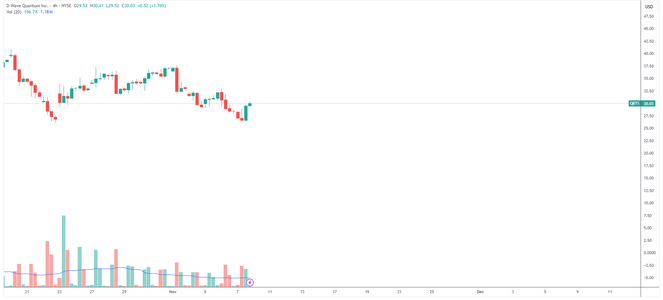
  • The current price action of the stock with ticker symbol QBTS has shown an inverted hammer on higher than average volume on a 4-hour extended hours chart along with the next candle fully engulfing the inverted hammer candle on higher than average volume as well very close to an area of major support on the daily chart of $26.37.
  • However, on the daily chart price has created a strong bullish candle, but the volume indicator shows below average volume as per the 20 SMA volume line.
  • I am a bit confused if this signals a market bottom or not as the 4-hour chart in my opinion is signalling a market bottom but the daily chart is not confirming this market bottom with an up move with higher than normal volume.
  • Could you please provide your view on QBTS and explain if you think the market has reached a bottom or not at the suppport level of $26.37


QBTS_2025-11-09_09-07-15.png


QBTS_2025-11-09_09-07-46.png
 

Attachments

  • QBTS_2025-11-09_09-07-46.png
    QBTS_2025-11-09_09-07-46.png
    41.6 KB · Views: 13
Last edited:
23,81 - 26,45 bottom zone 😉

View attachment 344368
Thank you for your chart and analysis. It is truly appreciated. A couple of questions on the chart. I am assuming the red zone as you have noted in your comments between $23.81 - $26.45 is a zone of support? Would you mind elaborating on why you think this is going to be the "bottom zone" and how you arrived at this support zone? Also, could you please explain what the green zone at the bottom with "Buy Power: 54" indicates?
 
I agree with you, OP, that the situation for QBTS looks rather ambiguous. And I even have the benefit of an extra day of trading to see how its going. 🙂

On the daily chart, there is nothing remarkable that would point us in one direction or the other. It may be that it just thrashes around for a while between the support you identified around $26.50 and somewhere in the mid-$30s.
Thank you, Xatta for your contribution. In your opinion, do you think this "thrashing around" is accumulation to move upwards towards higher price points or an accumulation to go lower? Could you kindly provide your thinking and the evidence you are using for your analysis whether it be technical or fundamental where possible? I am trying to decided whether to buy at this price point or not, but my concern is that the bounce it has had off of the support close to $26.37 is on low-ish volume which is not encouraging and the other candles being formed are also on low volume. I would have also liked to have seen a longer wick being formed below the support to see stops being taken out for the market to indicate that it has potentially flushed out people at that level and is looking to move upwards. Any thoughts anyone on this one?
QBTS_2025-11-11_18-19-00.png
 
Personally, I would just stay away from this stock for now. Here are some things to consider:

- Ever since the peak on Oct 15, volume on up days is not what it was during the uptrend. This might be ok and just a sign that the stock is forming a longer base. I don't get the feeling from it that a quick rebound is imminent.

- There is currently strong support around $26.50. The Fibonacci 61.8% retracement is there, plus the congestion area in September, plus it recently bounced off of that twice. It isn't a law of physics, unfortunately. If the market in general would roll over, then that support may disappear.

- The chart may be in the process of forming a (bearish) descending triangle.

- The stock tripled in a matter of a few weeks and can go back to where it started just as quickly if the hot money continues to dry up.

- OTOH, QBTS could give us a quick 20% rally and everything I wrote above might still be valid.

- Fundamentals are surely useless for a "quantum computing" stock. This is pure speculation.
 
Thank you Xatta for your contributions. A friend is trading this stock on a regular basis and has been asking about it so if you could continue giving me your opinions as you have been quite helpful in your views. I see a FVG in the shadded area as a potential point of reversal. Is there a better way of confirming if this will hold or not?
QBTS 2025-11-13 205946.png
 
  • On Friday 14th of November QBTS moved lower reaching $20.69 and tapping into the fair value gap zone of $22.23 - $19.16 on about average volume.
  • The candle with a long lower wick on average volume in the fair value gap zone near support could indicate potentially fading bearish momentum.
  • The next resistance on the move higher is at $26.07 a break above could push markets higher to the next bearish fair value gap zone between $35.06 - $32.53.

1763324936003.png
 
QBTS -- looks like FRI Nov 14th, 2025 "bottom" / day low of 21.47 is it (?) -- has to recapture 8ema (27) area

R3 = 26.876666
R2 = 25.332026
R1 = 24.70


P = 23.356666

S1 = 22.012026
S2 = 21.181306
S3 = 19.873666

1763328527785.png

Fri's Spread (day high - day low) = 3.52

3.52 x .382 = 1.34464 +/- P (23.356666) = R1 or S1
3.52 x .618 = 2.17536 +/- P (23.356666) = R2 or S2
3.52 +/- P = R3 or S3

P = Close + Day High + Day Low = 70.07 /3 = 23.356666 or 23.36
 
QBTS -- looks like FRI Nov 14th, 2025 "bottom" / day low of 21.47 is it (?) -- has to recapture 8ema (27) area

R3 = 26.876666
R2 = 25.332026
R1 = 24.70


P = 23.356666

S1 = 22.012026
S2 = 21.181306
S3 = 19.873666

View attachment 344561
Fri's Spread (day high - day low) = 3.52

3.52 x .382 = 1.34464 +/- P (23.356666) = R1 or S1
3.52 x .618 = 2.17536 +/- P (23.356666) = R2 or S2
3.52 +/- P = R3 or S3

P = Close + Day High + Day Low = 70.07 /3 = 23.356666 or 23.36

Yes, my figures for the bottom are slightly different as I prefer to use the CFD chart as it gives me a more continous representation of price movement. Yes, also agreed that your EMA might be the next possible barrier to overcome for this stock.
 
  • Price action and volume analysis from yesterday's trading does not show much of an anomaly. The candle that was formed was a bearish narrow bodied candle on lower than average volume.
  • There is support between $22.34 - $17.70 indicated by the yellow fairvalue gap support zone and the fibonacci clusters shown by the blue lines. With the fibonacci clusters at approximately $17.70 the measured move of the initial correction downwards is visible. There is also the 78.6% retracement level around the $21.18 region combined with other extensions.
  • Still waiting to see how market reacts to the current zone in terms of any anomaly visible between price action and volume.
QBTS_2025-11-18_06-36-42.png
 
  • The most recent candle for QBTS as shown on the chart below appears to be similar to that of a bullish spinning top created on lower than average volume around the zone that is supported by the fair value gap and fibonacci clusters.
  • The pattern overall is a warning sign of a potential bullish reversal, but it requires confirmation due to the nature of the spinning top and the lower volume. It seems the market has paused its selling, has found support, and there is a balance between buyers and sellers.
  • Important to see the next candle to confirm the direction. Will be on the look out for a bullish confirmation candle that closes above the high of the spinning top. This would indicate that buyers have resolved the indecision and are starting to take control, confirming the support is holding and a reversal is beginning.

1763539109031.png
 
  • The most recent candle for QBTS has formed what appears to be an inverted hammer candlestick pattern near support/bullish fair value gap, which in theory is a bullish reversal sign.
  • However, the pattern was formed on below average volume indicating a lack of strong conviction behind the initial buying attempt and acting as a warning flag.
  • To look for longs, a break and close above $24.98 on the lower timeframes would be needed to see a break of structure in the bullish direction.
1763621236633.png
 
Back
Top