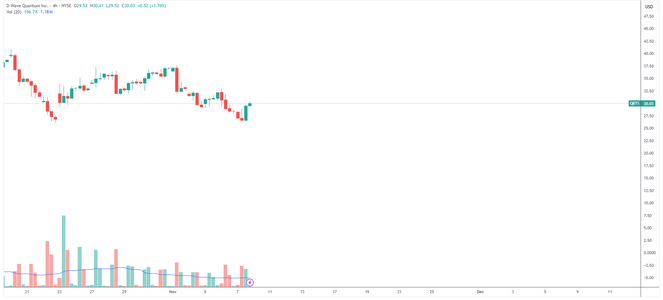
- The current price action of the stock with ticker symbol QBTS has shown an inverted hammer on higher than average volume on a 4-hour extended hours chart along with the next candle fully engulfing the inverted hammer candle on higher than average volume as well very close to an area of major support on the daily chart of $26.37.
- However, on the daily chart price has created a strong bullish candle, but the volume indicator shows below average volume as per the 20 SMA volume line.
- I am a bit confused if this signals a market bottom or not as the 4-hour chart in my opinion is signalling a market bottom but the daily chart is not confirming this market bottom with an up move with higher than normal volume.
- Could you please provide your view on QBTS and explain if you think the market has reached a bottom or not at the suppport level of $26.37
Attachments
Last edited:

