troyresearch
Active member
- Messages
- 132
- Likes
- 0
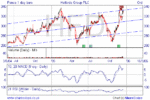
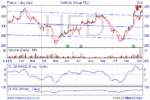
Thought I'd sanity check my reading of the chart for HFD as a large part of me thinks it looks like a great - if a little slow - a shorting opportunity.
1. Upward channel since Q3 2004 (270 support to 320 resistance from Q1 2005)
2. Each upward / downward move takes an avg 2-3 months, avg 15% move each way
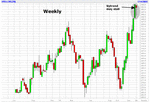
3. Just completed fourth leg of an Elliott Wave move
4. Gapped up last week, following results announcement, also a disclosure that a Japanese investor has taken a 5% stake
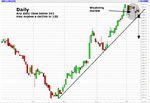
So I' counting on a downward move from Friday's close of 329 down to around 280 by, say Feb 2006.
However, MACD (10,20) has just crossed upwards with RSI (21) still sitting a good 15 points above the midline, suggesting that buying sentiment remains healthy.
Would appreciate some other perspectives on this...


