A month ago we reviewed gold and our conclusion was that the fifth attack on the $1,000/oz level in two years was highly likely to lead to a decisive upside breakout. We looked and saw that a suspected massive short position in gold was likely to lead to an explosive rally, as shorts were forced to cover. We analyzed the weekly chart (below) as well as a daily chart to come up with our target of $1,300 - $1,500/oz.
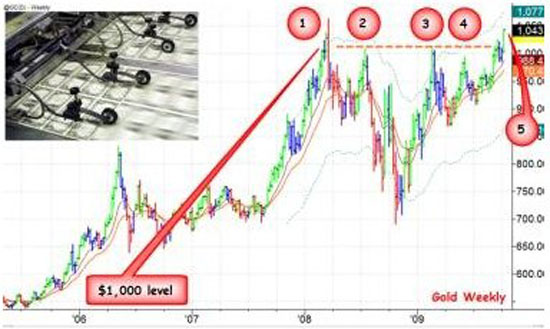
Keep in mind that targets can be dangerous if we hold to them with an iron fist. The key fact is that gold is in uptrend. A target is merely a device to help formulate a trading plan in the direction of that trend.
Last month we recommended trading gold futures and stocks from the long side and offered several tactical points. Let's now look at the current charts for an update.
We always begin by looking at the weekly charts to make strategic decisions, then turn to the dailies to define our tactics for entries and exits. Since we have already made our strategic decision last month to be long gold, today we are going to reverse this order and look at the daily chart first.
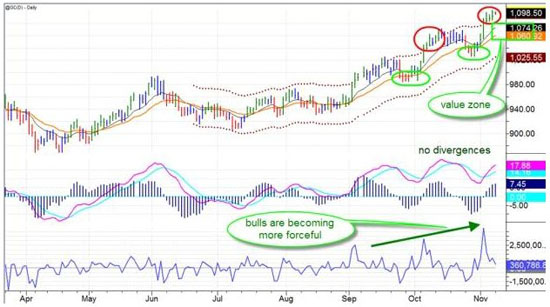
The daily chart confirms that the uptrend is strong, with zero bearish divergences. Prices keep oscillating within a channel. Normally we look to buy value (marked by green ovals below the EMAs) and sell above value (red ovals above the channel). Instead, our inclination now, in this strong uptrend, is to add to longs on pullbacks to value, but not to sell everything above the daily envelope. This trend has legs!
The value zone is between $1074 and $1060 today, but keep in mind that these levels are rising by about $5 a day. To repeat: we use the daily chart to find levels for adding to long positions but not for selling. To find selling targets in a strong bull market, we better turn to the weekly charts.
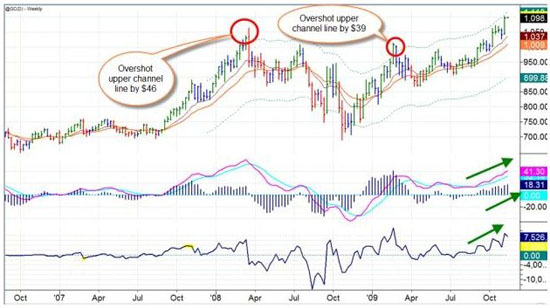
The weekly chart reminds us to be patient. Holding a long position is hard, which is why most people grab a quick buck and do not get anywhere near the full-size gain available from a trend. You can see on this weekly chart that when gold gets going, it tends to overshoot its upper channel line by about $40. That line stands at $1,118 today and is rising by about $10 a week.
In summary, the uptrend in gold appears healthy. It makes sense to use pullbacks to value on the daily charts for adding to long positions, while holding off major profit-taking until prices have rallied about their channel on the weekly charts.
Dr Alexander Elder can be contacted through his website at Elder.com
Keep in mind that targets can be dangerous if we hold to them with an iron fist. The key fact is that gold is in uptrend. A target is merely a device to help formulate a trading plan in the direction of that trend.
Last month we recommended trading gold futures and stocks from the long side and offered several tactical points. Let's now look at the current charts for an update.
We always begin by looking at the weekly charts to make strategic decisions, then turn to the dailies to define our tactics for entries and exits. Since we have already made our strategic decision last month to be long gold, today we are going to reverse this order and look at the daily chart first.
The daily chart confirms that the uptrend is strong, with zero bearish divergences. Prices keep oscillating within a channel. Normally we look to buy value (marked by green ovals below the EMAs) and sell above value (red ovals above the channel). Instead, our inclination now, in this strong uptrend, is to add to longs on pullbacks to value, but not to sell everything above the daily envelope. This trend has legs!
The value zone is between $1074 and $1060 today, but keep in mind that these levels are rising by about $5 a day. To repeat: we use the daily chart to find levels for adding to long positions but not for selling. To find selling targets in a strong bull market, we better turn to the weekly charts.
The weekly chart reminds us to be patient. Holding a long position is hard, which is why most people grab a quick buck and do not get anywhere near the full-size gain available from a trend. You can see on this weekly chart that when gold gets going, it tends to overshoot its upper channel line by about $40. That line stands at $1,118 today and is rising by about $10 a week.
In summary, the uptrend in gold appears healthy. It makes sense to use pullbacks to value on the daily charts for adding to long positions, while holding off major profit-taking until prices have rallied about their channel on the weekly charts.
Dr Alexander Elder can be contacted through his website at Elder.com
Last edited by a moderator: