fibonelli
Experienced member
- Messages
- 1,338
- Likes
- 288
In view of the ramifications from the US credit bubble and a possible war with Iran.
I thought it would be a good idea to start a new thread covering the two main precious metals (Gold & Silver) and Crude Oil.
For myself, I have selected Gold to be one of the instruments that I would trade on an EOD basis.
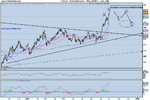
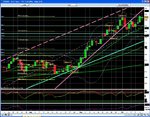
To start off, here's a weekly chart of Gold clearly showing a triangle formation.
I thought it would be a good idea to start a new thread covering the two main precious metals (Gold & Silver) and Crude Oil.
For myself, I have selected Gold to be one of the instruments that I would trade on an EOD basis.
To start off, here's a weekly chart of Gold clearly showing a triangle formation.