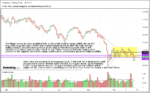
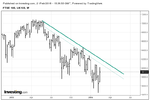
Still can't trade, but here's my thoughts on FTSE (monthly, weekly, daily)
http://www.investtech.com/main/market.php?CompanyID=99200028&product=52
Still can't trade, but here's my thoughts on FTSE (monthly, weekly, daily)
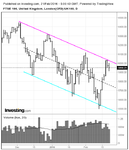
Even tho there's been no climactic low, its ability to lift so effortlessly the past few days suggests that the selling pressure is at least temporarily over. However, given the extent and length of its decline, don't be surprised if it ranges between 400 and 428 for a while. If you can buy it closer to 400, so much the better.
Db
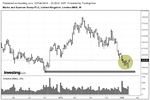
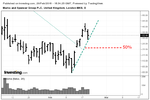
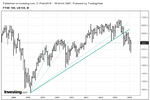
Looks like there might be a decision to make on Monday (this is where SLA comes into conflict with my usual 3 bar retracement where I would still be looking retracement when less than 50%)
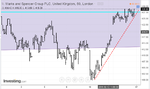
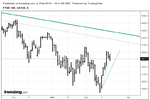
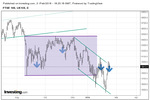
FTSE Daily.
Gringo
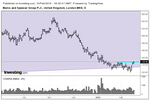
Going off the daily and monthly ftse charts it could be a big drop unless we break up
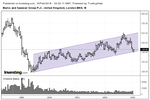
It's also worth noting the circumstances before the decline. Notice in particular the volume that accompanied the failed effort to make a higher high in October. Buyers were not exactly rushing the barricades.
It's difficult for a stock to succeed if the market is not behind it. But those which resist the pull most are also those most likely to do best and do it earlier than those which don't.
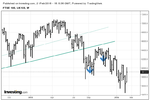
Don't quarrel with the analysis at all, although looks slightly different on the futures.
Price will tell us, of course, but I'm not jumping the gun 🙂
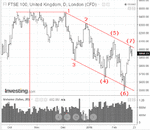
There's no important conflict. The daily illustrates that the angle of decline has become more severe, which is one advantage of using both weekly and daily charts. And there's nothing wrong with taking a counter-trend trade as long as one understands that it is in fact counter-trend.
It would also be informative and instructive -- if one wants to apply all this to future movements -- to go back a bit farther to see how and where and when the uptrend became a downtrend in the first place.
Db
ok - as well as your earlier thoughts as to action/volume at the "top"