Getting to Grips with DbP/Wyckoff

barjon

Legendary member
Messages
10,752
Likes
1,863
Over the years I've tried several times to get to grips with Wyckoff without much success. DbPhoenix's stuff is by far the best Wyckoff gripper I've come across so I thought I'd have another go at understanding the markets using DbP's SLA - http://www.trade2win.com/boards/tec...ht-line-you-can-become-successful-trader.html - as the primer.

The thread will be mainly observations for thought and discussion, a bit of "where are we now" type planning, with a few trades thrown in now and then.

So when you see a :idea: your twopennyworth would be appreciated.
 
Last edited:
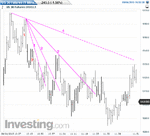
Ok, first up what happened to me on the DOW M5 yesterday.

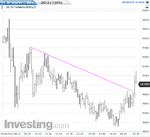
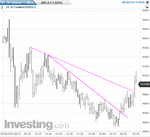
After a downward drift day within channel price broke the trendline with what seemed like increased momentum and a 15 minute spell of rising price with barely a pullback. Having got through price pulled back

:idea: why - buyers holding off or sellers applying pressure

Since price started north again with decent momentum it was maybe more to do with buyers holding off a bit than selling pressure. I entered. Price went right on north but couldn't sustain it and came back fast to break the new up trendline - I exited for a tiny loss.

:idea: obviously too early exit in hindsight but maybe better sticking with original stoploss so early in the trend

What came next was the observation central to this post.

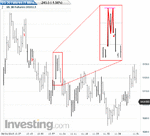
Quite a vigorous down and up range for a few bars - much better seen on M1.

:idea: not quiet movements but pretty heavyweight pushing and shoving it seemed. Did that make it more likely for a strong burst out if it came.

That strong burst did come, of course, while I was away having a cuppa and so left to watch and curse .
 

Attachments

  • dowm5.jpg
    dowm5.jpg
    70 KB · Views: 346
  • dow2.jpg
    dow2.jpg
    66.1 KB · Views: 390
  • dow3.jpg
    dow3.jpg
    63.3 KB · Views: 338
Last edited:
Barjon, did you have a profit target in mind for the trade you took? Glancing at the chart the price went up to the price it was at prior to the downtrend (16180), wouldn't that have been a good time to exit or move your stop? Especially as the price increase happened so quickly. Dbp has said that rapid increases in price can't be sustained as buyers run out of sellers. Although this is 5 min so I don't know if that still applies.

Just some thoughts from a beginner. Interested to know what you think.

Cheers

Mateus
 
If I may, and considering the extent of your experience in trading, you would likely get the most out of this exploration by providing the context, what I refer to as approaching the trade. If these movements are analyzed without context, in the middle of nowhere, they are essentially meaningless, at least in terms of extracting profits from them.

You've seen my display, the "sextych", with the daily, hourly, 15m, 5m, 1m, and 5s all grouped together. This enables me to see what I need to see and assess in no more than a minute where we are and why and where we're most likely to go. Whether anyone else adopts this or not is up to him. But one should plot a weekly chart at least once a week (it needn't be part of the display) and a daily, hourly, and 5m chart (and a 1m, if daytrading). Appendix G in the book should make the reasons why clear.

The following is provided as an example. The weekly would not ordinarily be included, and an EOD trader wouldn't care about 5m or 1m charts. But it's a starting point. It perhaps illustrates what I mean by the "gestalt" of the trading environment.

These charts lead up to the NY open. If you want to annotate them, I'll review your work if you like. This preparation is not unlike that of preparing a performance in a play: reading the script, learning your lines, understanding who your character is, who the other characters are, your relationships with them, their relationships with each other, what they've been doing, what you've been doing, where you've come from, what you want to accomplish, whether your goals will be in synch with those of the other characters or will conflict with them, and so on, as opposed to simply walking on stage without even knowing what play you're in.
 

Attachments

  • sextych1.gif
    sextych1.gif
    114.6 KB · Views: 463
Barjon, did you have a profit target in mind for the trade you took? Glancing at the chart the price went up to the price it was at prior to the downtrend (16180), wouldn't that have been a good time to exit or move your stop? Especially as the price increase happened so quickly. Dbp has said that rapid increases in price can't be sustained as buyers run out of sellers. Although this is 5 min so I don't know if that still applies.

Just some thoughts from a beginner. Interested to know what you think.

Cheers

Mateus

No, SLA requires that you stay in the trade until the trendline is broken. What you lose on the roundabouts of this example you gain and then some on the swings of an extended move.

There is always the temptation to grab a profit when it's there and there is often much left on the table as a result. DbP's view is that when your trade has gone favourably you should be looking for reasons to stay in rather than reasons to get out. Good advice in my opinion.
 
Last edited:
.................If I may, and considering the extent of your experience in trading, you would likely get the most out of this exploration by providing the context, what I refer to as approaching the trade.............


Yes, that is the intention of the thread as I said in the opening post. I started with the actual DOW trade since it was fresh in my mind and I thought that little range pertinent.

Mind you, if you had done all the approach work and entered in the correct place according to context it wouldn't be all that long if you followed the "rules" - long 'til the trendline goes, then short, then long again, then short, etc - before you found yourself trading in no-man's-land so far as context was concerned?
 
...............These charts lead up to the NY open. If you want to annotate them, I'll review your work if you like..........

ok - here goes, just trying to establish current context.
 

Attachments

  • dbplesson.JPG
    dbplesson.JPG
    249 KB · Views: 523
Very nice.

This is what I did . . .

As for "Mind you, if you had done all the approach work and entered in the correct place according to context it wouldn't be all that long if you followed the 'rules' - long 'til the trendline goes, then short, then long again, then short, etc - before you found yourself trading in no-man's-land so far as context was concerned?", we'll get to that shortly.
 

Attachments

  • sextych2.gif
    sextych2.gif
    137.1 KB · Views: 450
So that this doesn't go on for days, let's stick with the 1m for the time being, and while I don't want to seem patronizing, it's important that we start on and stay on the same page.

These 1m charts take you up to 1050 (NYT). How would you "play" them using the SLA?
 

Attachments

  • sextych3.gif
    sextych3.gif
    58.9 KB · Views: 415
So that this doesn't go on for days, let's stick with the 1m for the time being, and while I don't want to seem patronizing, it's important that we start on and stay on the same page.

These 1m charts take you up to 1050 (NYT). How would you "play" them using the SLA?

OK, don't bother about seeming patronising - you're not. So just fire away without worry.
 

Attachments

  • dbplesson2.JPG
    dbplesson2.JPG
    163.3 KB · Views: 541
Actually, it's the opposite . . .

Yes of course sorry. I'm getting my words mixed up a little but I get the idea. Once sellers run out of buyers at the high they then start offering or accepting bids at lower prices and once there are no more buyers at that level they lower it again and so on and so on. The price on the chart reflects the last traded price.
 
This is what I did. The only appreciable difference is your first long. Most people would rather wait until after the open. But there are of course ops for those who are "quick" and decisive.

As for the last short, at this point many would begin to become tangled in lines rather than focus on price/trader behavior. The key here is not whether some line or other is or has been or is about to be broken but that by now you've got two lower highs. A lower high provides a message, i.e., buyers are no longer willing to pay the ask, and here they've declined twice. That's important to know and will likely provide the extra motivation for taking the short, perhaps with an understanding reached with oneself that if the demand line is not broken, the trade will be exited.

All that aside, it's important to note that the second op ("2") would also work, mostly because the market context is favorable (if it weren't, the trade would be stopped out almost immediately; note further that the longer one waits, the higher the price risk).

Any questions? Comments? Quibbles?
 

Attachments

  • sextych4.gif
    sextych4.gif
    64.8 KB · Views: 468
This is what I did. The only appreciable difference is your first long. Most people would rather wait until after the open. But there are of course ops for those who are "quick" and decisive.

As for the last short, at this point many would begin to become tangled in lines rather than focus on price/trader behavior. The key here is not whether some line or other is or has been or is about to be broken but that by now you've got two lower highs. A lower high provides a message, i.e., buyers are no longer willing to pay the ask, and here they've declined twice. That's important to know and will likely provide the extra motivation for taking the short, perhaps with an understanding reached with oneself that if the demand line is not broken, the trade will be exited.

All that aside, it's important to note that the second op ("2") would also work, mostly because the market context is favorable (if it weren't, the trade would be stopped out almost immediately; note further that the longer one waits, the higher the price risk).

Any questions? Comments? Quibbles?

Yes, I was up to the message of the lower high (why I chose to close the long where I did) but did get hooked up with the lines in looking for the short.

The main questions I've got from this little lot is what to do when the retracement you're looking for to trigger an entry takes out the trendline you've drawn before it's finished. I would tend still to take the trigger if the surrounding context looked ok, but I'm not sure whether that would be correct in SLA terms.

The second one is the "getting to no-mans-land" one.

As to your first question, the lines are a guide, not braces. Taking the entry is fine, even though it's pre-emptive, as long as one has decided what he will do if the trade doesn't do what he expects it to do.

As for the second, yes, we are at that point, which is where the next chart comes in.

Regardless of whether the trader took short 1 or short 2, he'd be likely to draw the first supply line (SL1). Those who are new to this should exit as soon as this line is broken and begin logging their observations.

Those who are not so new to this would let price swing a little, particularly if their entry was not in danger. If they did so, they would then be able to draw SL2.

After this is where experience and calm come into it given that the break of SL2 is or seems to be a dramatic one, reaching all the way past the second short entry (note, again, that if the first and best short entry were taken, the upsurge after the break of SL2 would not be as much of a concern). At this stage, I'd like for you to review -- or read, if you have not yet gotten that far -- the "Continuity of Price" entry in Notes, p. 18. What follows, or will follow, will make more sense.
 

Attachments

  • sextych5.gif
    sextych5.gif
    27.4 KB · Views: 336
Re-read Continuity of Price, so set to go.

I might have let it go to SL2 - in which case I'd've taken a third short - but I would have had some trouble letting it go to SL3 since to get there would have involved taking out the previous swing high.
 
Yes, letting it go to SL3 would be unreasonable, available only in hindsight, as it would mean abandoning most if not all of the rules.

However . . .

One of the messages I try to put out there in the book is that the trade isn't over just because the trader has exited it. Here, if one continues to pay attention rather than focus on how much money he's made/lost, he can see that price is still in trouble, and if he also notes the double top, which makes yet another lower high, he might just summon the courage to enter a new short below all of this. After all, what has he got to lose, other than a few points? Hasn't he made enough already?
 

Attachments

  • sextych6.gif
    sextych6.gif
    24 KB · Views: 232
At which point, I suggest to those who try this to switch out to a more macro view, at least the 5m. This helps avoid getting tossed out of the trade due to swings that are largely irrelevant.
 

Attachments

  • sextych7.gif
    sextych7.gif
    23 KB · Views: 241
Last edited:
One can also plot a "tighter" supply line due to the proximity of 16020 (see the daily chart) and take the money rather than give so much back waiting for the break of the higher supply line.
 

Attachments

  • sextych8.gif
    sextych8.gif
    24.2 KB · Views: 222
Yes, letting it go to SL3 would be unreasonable, available only in hindsight, as it would mean abandoning most if not all of the rules.

However . . .

One of the messages I try to put out there in the book is that the trade isn't over just because the trader has exited it. Here, if one continues to pay attention rather than focus on how much money he's made/lost, he can see that price is still in trouble, and if he also notes the double top, which makes yet another lower high, he might just summon the courage to enter a new short below all of this. After all, what has he got to lose, other than a few points? Hasn't he made enough already?

Ah, we've gone off-piste so far as SLA is concerned :LOL: Very pertinent and nice though.

Here's my thoughts for trading FTSE tomorrow.

:idea: Just a thought when tracking indices. With such huge volumes changing hands at pre and post market auctions aren't these the major thing to sort out S/R?

ps: Seem to have chopped off the time frames. Should be self-evident, it runs weekly, daily, hour, M5
 

Attachments

  • ftseweek.jpg
    ftseweek.jpg
    120.1 KB · Views: 221
  • ftseday.jpg
    ftseday.jpg
    98 KB · Views: 206
  • ftsehour.jpg
    ftsehour.jpg
    85.2 KB · Views: 212
  • ftsem5.jpg
    ftsem5.jpg
    101.4 KB · Views: 229
Top