Geometric technical analysis

Lecic

Junior member
Messages
33
Likes
0
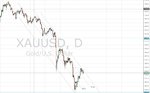
Here you have a real sharp method lends itself superbly to swing and long term investments. The method does not take into account of indicators, formations or volumes etc And it is entirely geometric.

As I studied the technology itself for several years, if you have questions you can ask it here.

best regards
 
Last edited:
yes these are not what you usually see so I understand that you disagree with me.
But if you study my videos so you may change your mind,,,
 
yes these are not what you usually see so I understand that you disagree with me.
But if you study my videos so you may change your mind,,,

You are right, its not often I see a 45degree angle being called 90
 
360 /4 = 90

no sh1t really :rolleyes:..that doesn't explain why you are calling a rising line, 90 degrees. it is either horizontal or vertical. anyway, im sure thats just a slip of the tongue the trouble is all goes down hill from there and thats just after a few seconds
your gold analysis was classic though
"you are bullish here, or here, or even here..whatever you want"
thats a very loose/subjective view of determining whether you are bullish in an obvious bearish trend
anyway, I'll leave it at that, whatever works for you
 
It is 90 degree relationship ho was important,,, but if you look at al the videos you may understand how good the tecnique is for swing and long term investors,,,
 
I will not discount your particular method, if you are able predict possible important price points with it. I must say though that when I first started trading I also drew lines such as these and the problem I had was that if the market stops trending I started to get churn and lost money so I have up on that type of system. I have heard that all you need to trade is a single horizontal line but never ascribed to that.

Cheers

100% with you numbertea, a trend line is only good in hindsight. where you can nicely match up your lows/highs. You've got to wait for them to take place before a line can be drawn. otherwise you start drawing, and then its crossed, you draw another, thats crossed etc etc. 5th attempt becomes a better one.
Attached is a lovely chart of Gold, with a trend channel which looks to be containing sections of this trend.
None of this could have been drawn until all of the high lows had taken place.
By then your trend is over.
This is all hindsight trading

Thats on conventional charts mind.
A45degree trend line on a point and figure chart however stays there forever.
 

Attachments

  • gold.JPG
    gold.JPG
    110.9 KB · Views: 197
Top