GBPUSD

konstantinresto

Junior member
Messages
11
Likes
1
long term investment
development of the GBPUSD currency pair in the interval of the - month


demonstrating the work of small and large pricing models of this pair

October - work in the range of the September candle

November - growth

December, January February - a downtrend

March - the beginning of growth
 
Last edited:
Amazing colourful charts. I thought I'd tumbled back into that old thread about art from last year. Charts by Kandinsky?

But what does it all mean?
 
Tentative breakdown on the GBPUSD below the 1.2300 level, the pair may continue dropping towards the 1.2200 zone. Above the 1.2300 level, the 55 day EMA may act as resistance.
 
The volatility rises on the GBPUSD, taking the price all the way down to the 1.2200 zone, but bouncing back up to the 1.2300 area. The pair is very undecided around the 1.2300 level, from where it may head in any direction.
 
The uncertainty surrounding the Brexit is creating a lot of volatility, but indecision on the GBPUSD around the 1.2300 level. The daily candles are in the form of dojis, which is an idecision pattern, but with long shadows indicating high volatility. From the current level, the pair may head in any direction.
 
Thank you for your analyses.

For the melting pot.....the VRM described in the first post of the FOREX thread "Predicting future FX support and resistance levels using mathematics" sees the GBPUSD currently short term bearish.

VRM charts for GBPUSD ending tomorrow 3rd October 5 pm NY time are attached. Coloured levels are the key levels.

On the 23rd September the GBPUSD closed below the middle of the VRM short term trend channel middle and became short term bearish.

Today the middle of the VRM short term trend channel is 1.2406. Until the GBPUSD finds support on the middle of this short term trend channel then the GBPUSD will continue to fall.

Let's see what happens.

gbpusd.PNG
 
Thank you for your analyses.

For the melting pot.....the VRM described in the first post of the FOREX thread "Predicting future FX support and resistance levels using mathematics" sees the GBPUSD currently short term bearish.

VRM charts for GBPUSD ending tomorrow 3rd October 5 pm NY time are attached. Coloured levels are the key levels.

On the 23rd September the GBPUSD closed below the middle of the VRM short term trend channel middle and became short term bearish.

Today the middle of the VRM short term trend channel is 1.2406. Until the GBPUSD finds support on the middle of this short term trend channel then the GBPUSD will continue to fall.

Let's see what happens.

View attachment 267840

Last night I posted the VRM predictions for GBPUSD ending today 5 pm New York time.

I attach two GBPUSD files of results for today using 30 minute and 1 hour candlesticks. Yesterday's predictions were colour coded. These colour coded levels are shown on the charts attached. Top chart shows weekly levels. Bottom chart shows daily levels.

There was a monster buy trade for GBPUSD from VRM daily level 1.2268 up to the middle of the VRM short term trend channel at 1.2406. The GBPUSD could not break up through this level and fell back.

GBPUSD did not break through the middle of its short term trend channel at 1.2406. It is still short term bearish.

2019-10-03-GBPUSD-1hr-1hr.png

2019-10-03-GBPUSD-30min-30min.png
 
The GBPUSD keeps oscillating around the 1.2300 level, with no direction, but high volatility. The range is between the 1.2200 and the 1.2400 levels, a breakout of any of those two levels could accelerate the momentum.
 
VRM charts for GBPUSD and EURGBP ending tomorrow 14th October 5 pm NY time are attached. Coloured levels are the key levels.

The VRM is described in the first post of the FOREX thread "Predicting future FX support and resistance levels using mathematics"

4 weeks ago the GBPUSD VRM long term trend channel started to rise (green middle curve) and the EURGBP long term trend channel (green middle curve) started to fall.

EURGBP chart --- Last Friday the middle of the short term trend channel (blue) bounced off the middle of the long term trend channel (green).

GBPUSD chart --- Last Thursday/Friday the bottom of the short term trend channel (blue) bounced off the bottom of the long term trend channel (green).

Let's see what the week will bring.

eurgbp.PNG

gbpusd.PNG
 
Last post I attached the VRM charts for GBPUSD and EURGBP ending today 14th October 5 pm NY time. Coloured levels are the key levels.

The VRM is described in the first post of the FOREX thread "Predicting future FX support and resistance levels using mathematics"

I attach the 15 minute charts for GBPUSD & EURGBP about the volatility today. Lines on the charts are coloured lines from the predictions in my last post.

Volatility described well within VRM levels

2019-10-14-1440-GBPUSD-EURGBP-15min-15min.png
 
long term investment
development of the GBPUSD currency pair in the interval of the - month


demonstrating the work of small and large pricing models of this pair

October - work in the range of the September candle

November - growth

December, January February - a downtrend

March - the beginning of growth


I think you should stop falling into trap of your own imagination. Though many technical analysts suffer from that. Pay attention fundamentals in this pair, because there are lots of "event risk" that can destroy any channel, resistance and support. Just recall how Pound surged from 1.22 to 1.29 after the breakthrough in negotiations.
 
I think you should stop falling into trap of your own imagination. Though many technical analysts suffer from that. Pay attention fundamentals in this pair, because there are lots of "event risk" that can destroy any channel, resistance and support. Just recall how Pound surged from 1.22 to 1.29 after the breakthrough in negotiations.

Here I talked about how the pound will behave even on a 15-minute chart.

Your risks do not interest me

269667
 
Last edited:
My view on GBPUSD. This will be the last leg down. Once UK elections are done, Labours likely to face defeat and Brexit will take place and GBPUSD will go above 1.30 and hit 1.35xx

1f64f.png
 

Attachments

  • GU.jpg
    GU.jpg
    127 KB · Views: 145
What do you guys think GBP/USD will go to if we get a Tory majority next week? Above one 1.30 now, People saying 1.35? Higher?
 
GBPUSD weeping and gnashing of teeth by Brits all over the place at T2w and London and almost everywhere. there seems to be just nothing that will provide some respite to this currency.

Fibo states get ready for rally to the vicinity of 1.4562 - 1.5284 or 1.6137.


Wake up, dummies. See quote. GBPUSD Long on Daily to 1.4562 was called on August 22, 2019 and dig this, just 8 trading days before the bottom on September 3rd. Its been Looooooong ever since

-------------------------------------------------------------------------------------------


Reminder: GBPUSD rally get ready called on August 22nd

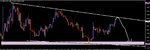
On daily, NO trendline break yet, so no entry on the larger timeframe YET. But note the trendline is validated by GBP as she hit it again and then promptly reversed. Good sign.

But count the # of waves, then see the possible 261.8% hit.

So remember ................... SHORT is still in play ............ but respite likely? Thus far elusive, no respite but divergence keeps building, wave count favorable.

I don't see an entry on 4H either.

But the Alert is still in effect while short continues

---------------------------------------------------------------------------------------------


you got a twofer ............. here's your other pal, GBPUSD.

Nailed him too. You had questions or doubts about Macd - see the divergence response unit? Stellar. Never underestimate the creme de la creme indicator. Trendline busted too


View attachment 267197

Nailed the low - and dig this, while every mother's son in UK was heavily bearish the GBP. See thread GBP sucks for the reality. Everyone had thrown in the towel. Except for Fibo who timed the turn at T2W, cott it and called the long to 1.4 region

------------------------------------------------------------------------------------


SLAM DUNK! :):whistle:

Jesus H Christ, what a call from August 20 (pls check) ..............
"GBPUSD weeping and gnashing of teeth by Brits all over the place at T2w and London and almost everywhere. there seems to be just nothing that will provide some respite to this currency
Fibo states get ready for rally to the vicinity of 1.4562 - 1.5284 or 1.6137"


look at the the chart edge in the chart in post dated Sept 3. Then read the following within quoted text .... no trendline break yet, no 4H entry either, but #waves, then see the possible 261.8% hit, ALERT still in effect while SHORT continues


That was the very last bar, Sept 3. Then there was nothing to update as the trendline was taken out on Sept 5. I was banned around about that time. Trader333 can plug in the exact date of the ban. :):):):) ROFLMAO was I banned so that the Brits would not have to bear the pain of saying thank you to the most hated person they've ever encountered from America? Nothing would surprise me no more!!!!!!!!!! ROFLMAO


---------------------------------------------------------------------


For NVP to look thru': Post #760

My August 22nd post when GBPUSD was going down and down and down and everybody was complaining and there was even a thread here title something like GBP sucks. Everywhere around the globe the Brits were complaining and beside themselves with frustration over GBP crashing crashing crashing

Now read quote above for a stunning call by Fibo - this call is still playing out and we got to 1.3 already. Will evaluate it further this week.

Look at the updated chart, NVP. That rally I called on August 22 was just a few days before the bottom.

updatd chrt from today below ................ look at GBP's hard on. My my my.

Americans would hug and kiss me like they do at ET, but Brits? No way Jose - instead they ban me. :) :) :) :) :)


View attachment 269684


View attachment 267059

----------------------------------------------------------------------------


GBPUSD:

Gots to look at it tomorrow when I'm sober and the seminal vesicle is not burdened with over production - but I believe that the GBPUSD daily chart high right now is at 261.8% and that means we gots a ways to go to get to 423.6% - after this modest correction of course. But is it a reversal at 261.8%? haahahahaha I won't know until tomorrow for reasons already mentioned. She's in the shower and doing her makeup, came her from international on a one week first time ever meetup with me. Roosh is mind blown and totally f***d up as I joked with him he gots to go all the way to Eastern Europe to nail antelope, I do it right from here and make them come to me :whistle::whistle::whistle::whistle::whistle:

--------------------------------------------------------------------


The lost souls all come from the United Kingdom. They howl and cry and moan and groan like mad exactly at the darkest hour, never having learned from Life and Trading that the darkest hour is just before DAWN.

FIBO gots to jump in and save 'em.

Thread title: GBP sucks

WRONG as proven over and over again here. See charts GBPUSD

But wait! Who gives a sh*t about the Brits? Not me? I couldn't care less. I'm looking out for Rosa, the restaurant owner who is crippled by the high cost of spices she has to bring in from Thailand due to the strong Baht weak GBP its killin her.

I told her to watch for my signal. Help is on the way, reveral is coming. All evidence in this thread. First will be the reversal in the USD-THB, then quickly will follow GBP-THB.

Done!


Behold Rosa's good fortune as the spices get cheaper as GBP reverses against the Thai Baht. Behold the hard-on on the Macd taking out the previous wave high. Yeah baby the turn is in the Bend in the trend, a very good sign. Cavalry has arrived as GBP-THB bangs the 200-day ema


View attachment 270651
 
Top