zigglewigler
Well-known member
- Messages
- 346
- Likes
- 50
Here's something I've been working on in recent days. Still testing. It involves trading FX moves that last a number of days, but with entries timed on short term chart, attempting to catch an 'impulse' move, so that risk on entry is low, with clear stop point. It's a way of catching drops or rises at the point that the market has decided to go with it.
The risk reward ratio I quote is an approximation and not unusual, ie risk 100 points to make 500. I'm studying the £/$ rate, with 500 pip moves over several days common. There's enough volatility in FX to warrant some discretionary trading, ie wait for the good stuff!
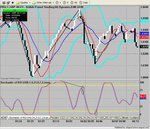
Bring up two charts. First is 60 mins Two-point break, with Bol Bands and a Stoch of RSI.(This is esignal, you might have similar alternative). Second one I use is a 13 mins Candle with main Pivot, an Up/Down Volume with MA, and MA of RoC.
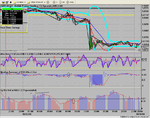
With the StochRSI on the 60 mins 2-point break chart, I'm looking for overbought/oversold states. The idea being to catch the move away to the opposite state and repeat. The StochRSI will show extreme turns at 10 and 90 levels, followed by a reversal line on the 2-point.
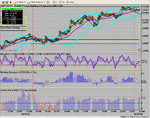
With the bigger picture established, I look at the 13 mins Candle and watch for the markets attitude to the main Pivot. It's the move from the Pivot that triggers an entry. When a candle straddles the Pivot with a notable move on the Up/Dn Vol, that is indication that the market is about to run with it. You can catch this move earlier with a pullback on the MaRoC. Also excessive Up or Down volume is a sign the market's turning.
The stop is simply the swing hi/lo.
There are times where price fails to touch the Pivot, but this failure can be interpreted in similar ways as above.
Also to consider is any further Pivot away moves in the direction of the 2-point break, so using the StochRSI as a trend indicator.
StochRSI often plots a double top/bot formation, with divergence to give strong clue that the run is over.
Euro/$ and Swiss/$ seem to give similar results, but I haven't had a close look yet.
I use a 21,9,7,2 Stoch of RSI setting and 21,7 Up/Dn Vol.
I'll attach some charts and esignal code files. Since I've just started looking at this, there's probably some tightening up to do. But what I'm sure about is that this approach beats smash and grab on minor r/s lines, you don't have to take many of these trades a month with a fair size position to be doing nicely thank you!
The risk reward ratio I quote is an approximation and not unusual, ie risk 100 points to make 500. I'm studying the £/$ rate, with 500 pip moves over several days common. There's enough volatility in FX to warrant some discretionary trading, ie wait for the good stuff!
Bring up two charts. First is 60 mins Two-point break, with Bol Bands and a Stoch of RSI.(This is esignal, you might have similar alternative). Second one I use is a 13 mins Candle with main Pivot, an Up/Down Volume with MA, and MA of RoC.
With the StochRSI on the 60 mins 2-point break chart, I'm looking for overbought/oversold states. The idea being to catch the move away to the opposite state and repeat. The StochRSI will show extreme turns at 10 and 90 levels, followed by a reversal line on the 2-point.
With the bigger picture established, I look at the 13 mins Candle and watch for the markets attitude to the main Pivot. It's the move from the Pivot that triggers an entry. When a candle straddles the Pivot with a notable move on the Up/Dn Vol, that is indication that the market is about to run with it. You can catch this move earlier with a pullback on the MaRoC. Also excessive Up or Down volume is a sign the market's turning.
The stop is simply the swing hi/lo.
There are times where price fails to touch the Pivot, but this failure can be interpreted in similar ways as above.
Also to consider is any further Pivot away moves in the direction of the 2-point break, so using the StochRSI as a trend indicator.
StochRSI often plots a double top/bot formation, with divergence to give strong clue that the run is over.
Euro/$ and Swiss/$ seem to give similar results, but I haven't had a close look yet.
I use a 21,9,7,2 Stoch of RSI setting and 21,7 Up/Dn Vol.
I'll attach some charts and esignal code files. Since I've just started looking at this, there's probably some tightening up to do. But what I'm sure about is that this approach beats smash and grab on minor r/s lines, you don't have to take many of these trades a month with a fair size position to be doing nicely thank you!